
Regulatory Oversight Report for Uranium and Nuclear Substance Processing Facilities in Canada: 2020
Table of contents
- Changes to 2020 regulatory oversight report
- Plain language summary
- 1 Introduction
- 2 Uranium processing facilities
- 3 Nuclear substance processing facilities
- 4 Research reactor facilities
- 5 CNSC regulatory oversight
- 6 The CNSC’s assessment of safety at uranium and nuclear substance processing facilities and research reactors
- 6.1 Management System
- 6.2 Human Performance Management
- 6.3 Operating Performance
- 6.4 Safety Analysis
- 6.5 Physical Design
- 6.6 Fitness for Service
- 6.7 Environmental Protection
- 6.8 Radiation Protection
- 6.9 Conventional Health and Safety
- 6.10 Emergency Management and Fire Protection
- 6.11 Waste Management
- 6.12 Security
- 6.13 Safeguards and Non-Proliferation
- 6.14 Packaging and Transport
- 7 The CNSC’s assessment of safety at uranium and nuclear substance processing facilities and research reactors
- 8 Overall conclusions
- References
- Acronyms and Abbreviations
- Glossary
- A. Links to Licensee Websites and Annual Compliance Reports
- B. CNSC Inspections
- C. Significant Changes to Licences and Licence Conditions Handbooks
- D. Regulatory Document Implementation
- E. Financial Guarantees
- F. Safety and Control Area Ratings
- G. Total Annual Releases of Radionuclides Directly to the Environment
- H. Public Dose Data
- I. Environmental Data
- J. Worker Dose Data
- K. Health and Safety Data
- L. Reportable Events
- M. List of Identified Indigenous Nations and Communities With an Interest in Uranium and Nuclear Substance Processing Facilities
- N. Participant Funding Recipients for the 2020 UNSPF and RRs Regulatory Oversight Report
Changes to 2020 regulatory oversight report
As with other regulatory oversight reports (RORs) produced by the Canadian Nuclear Safety Commission (CNSC), changes have been made to this report as a result of recommendations from the Commission and feedback from intervenors. CNSC staff made the following changes to the Regulatory Oversight Report for Uranium and Nuclear Substance Processing Facilities and Research Reactors in Canada: 2020:
- Performance reporting for research reactors is done on a 3-year frequency. These facilities were previously part of the RORs for nuclear research reactors and particle accelerator facilities, but will be included in this ROR from now on.
- Indigenous Nations and communities and their traditional and/or treaty territories are acknowledged at the beginning of the ROR and presentation.
- The executive summary was replaced with a plain language summary.
- Further details on all safety and control areas are included.
- More hyperlinks are used as content is readily available online (e.g., CNSC website, past regulatory oversight reports, etc.).
- Data provided for the Independent Environmental Monitoring Program includes an explanation on changes to analytical techniques.
Plain language summary
The Regulatory Oversight Report for Uranium and Nuclear Substance Processing Facilities and Research Reactors in Canada: 2020 provides information on the safety performance of the nuclear facilities named in the title. The report is based on CNSC staff’s work to ensure safety and protection for the people and the environment for licenced uranium and nuclear substance processing facilities (UNSPF), as well as research reactors (RRs). Over the reporting periods covered, all facilities continued to operate safely; monitoring data shows that food grown nearby is safe to eat, and that water is safe to drink. There were no releases that could have harmed human health or the environment.
This report also provides an update on CNSC staff regulatory activities pertaining to public information, community engagement, and aspects of the CNSC’s Independent Environmental Monitoring Program that relate to UNSPF and RRs. Where possible, trends are shown and information is compared to previous years.
This report provides information on the following licenced facilities in Canada:
- Uranium processing facilities
- Cameco Corporation Blind River Refinery in Blind River, Ontario
- Cameco Corporation Port Hope Conversion Facility in Port Hope, Ontario
- Cameco Fuel Manufacturing Inc. in Port Hope, Ontario
- BWXT Nuclear Energy Canada Inc. in Toronto, Ontario
- BWXT Nuclear Energy Canada Inc. in Peterborough, Ontario
- Nuclear substance processing facilities
- SRB Technologies (Canada) Inc. in Pembroke, Ontario
- Nordion (Canada) Inc. in Ottawa, Ontario
- Best Theratronics Ltd. in Ottawa, Ontario
- Research reactors
- Polytechnique de Montréal SLOWPOKE-2 research reactor in Montréal, Quebec
- McMaster Nuclear Reactor in Hamilton, Ontario
- Royal Military College of Canada SLOWPOKE-2 research reactor in Kingston, Ontario
- Saskatchewan Research Council SLOWPOKE-2 research reactor in Saskatoon, Saskatchewan
Each year, CNSC inspectors complete inspections at these facilities. The number of inspections and what is inspected depend on the individual site and how the facility has been performing. The CNSC uses a risk-informed approach when planning inspections. Over the respective reporting periods, CNSC staff performed a total of 28 inspections at the UNSPF and RRs. These inspections resulted in the issuance of 47 notices of non-compliance (NNC), which were all related to issues identified as low risk. In addition, to ensure non-proliferation obligations were met, 39 International Atomic Energy Agency (IAEA) initiated safeguards verification activities and 1 CNSC-initiated safeguards field activity were performed at the UNSPF and RRs. These regulatory activities resulted in the issuance of 3 NNCs, which were all related to issues identified as low risk. All NNCs are described in section 6 and section 7.2.2 of this report.
The CNSC uses 14 safety and control areas (SCAs) to evaluate the performance of each licensee, for which the resulting performance ratings are included in this report. Particular focus is placed on the radiation protection, environmental protection, and conventional health and safety SCAs, as these give a good overview of safety performance.
The SCA ratings in this report were derived from the results of activities conducted by CNSC staff to verify compliance. These activities included onsite and virtual inspections, technical assessments, reviews of reports submitted by licensees, reviews of events and incidents, and ongoing exchanges of information with licensees. For the periods reported on, CNSC staff rated all SCAs as "satisfactory" for all facilities contained in this report, and confirmed that all were operating safely.
The CNSC recognizes and understands the importance of building relationships with Indigenous Nations and communities in Canada. The CNSC’s goal is to build partnerships and trust through cooperative engagement activities. The facilities discussed in this report lie within the traditional and/or treaty territories of many Indigenous Nations and communities.
In 2020, the activities undertaken by CNSC staff supported their ongoing commitment to meeting consultation and accommodation obligations, and to continuing to build relationships with Indigenous Nations and communities with interests in Canada’s UNSPF and RRs.
In summary, workers at each facility were safe and properly protected and there were no releases that could have harmed the surrounding environments or the health and safety of Indigenous Nations and communities or people.
This report is available on the CNSC website, and the documents referenced in it are available to the public upon request by contacting:
Senior Tribunal Officer, Secretariat
Tel.: 613-858-7651 or 1-800-668-5284
Fax: 613-995-5086
Email: interventions@cnsc-ccsn.gc.ca
1 Introduction
Through the application of the Nuclear Safety and Control Act (NSCA) [1], and its associated Regulations, the Canadian Nuclear Safety Commission (CNSC) regulates Canada’s nuclear industry to protect the health and safety of persons and the environment and to implement Canada’s international commitments on the peaceful use of nuclear energy. The CNSC also disseminates objective scientific, technical and regulatory information to the public. Licensees are responsible for operating their facilities safely, and are required to implement programs that make adequate provision for meeting legislative and regulatory requirements and licence conditions.
This regulatory oversight report (ROR) provides an overview of CNSC regulatory efforts and staff’s assessment of uranium and nuclear substance processing facilities (UNSPF) in Canada for the 2020 calendar year. This report also provides CNSC staff’s assessment of research reactors (RRs) from 2018 to 2020, on which the Commission has directed CNSC staff to provide updates every 3 years.
The facilities covered by this report are:
- Uranium processing facilitiesFootnote 1
- Cameco Corporation Blind River Refinery (BRR) in Blind River, Ontario
(FFOL-3632.00/2022) - Cameco Corporation Port Hope Conversion Facility (PHCF) in Port Hope, Ontario (FFOL-3631.00/2027)
- Cameco Fuel Manufacturing Inc. (CFM) in Port Hope, Ontario
(FFOL-3641.00/2022) - BWXT Nuclear Energy Canada Inc. (formerly GE Hitachi Nuclear Energy Canada Inc.) in Toronto, Ontario (BWXT-NEC Toronto) (FFL-3621.00/2030)
- BWXT Nuclear Energy Canada Inc. (formerly GE Hitachi Nuclear Energy Canada Inc.) in Peterborough, Ontario (BWXT-NEC Peterborough)
(FFL-3620.00/2030)
- Cameco Corporation Blind River Refinery (BRR) in Blind River, Ontario
- Nuclear substance processing facilities1
- SRB Technologies (Canada) Inc. (SRBT) in Pembroke, Ontario
(NSPFOL-13.00/2022) - Nordion (Canada) Inc. (Nordion) in Ottawa, Ontario (NSPFOL-11A.01/2025)
- Best Theratronics Ltd. (BTL) in Ottawa, Ontario (NSPFOL-14.00/2029)
- SRB Technologies (Canada) Inc. (SRBT) in Pembroke, Ontario
- Research reactors1
- Polytechnique Montréal SLOWPOKE-2 research reactor in Montréal, Quebec (PERFP-9A.01/2023)
- McMaster Nuclear Reactor (MNR) in Hamilton, Ontario (NPROL‐01.01/2024)
- Royal Military College of Canada (RMC) SLOWPOKE-2 research reactor in Kingston, Ontario (NPROL-20.00/2023)
- Saskatchewan Research Council (SRC) SLOWPOKE-2 research reactor in Saskatoon, Saskatchewan (NPROL-19.01/2023)
This report discusses all safety and control areas (SCAs), but focuses on radiation protection, environmental protection, and conventional health and safety, as they provide a good overview of safety performance at licensed facilities. The report also provides an overview of licensee operations, licence changes, major developments at licensed facilities and sites, and reportable events. In addition, the report includes information on public information programs, COVID-19 responses by licensees and the CNSC, and engagement with Indigenous Nations and communities.
2 Uranium processing facilities
Uranium processing facilities are part of the nuclear fuel cycle that includes refining, conversion and fuel manufacturing. The fuel produced is used in nuclear power plants for the generation of electricity.
2.1 Cameco Blind River Refinery
Cameco Corporation owns and operates the Blind River Refinery (BRR) in Blind River, Ontario. The facility is located about 5 km west of the town of Blind River and south of Mississauga First Nation, as shown in figure 2-1.
.png/object?subscription-key=3ff0910c6c54489abc34bc5b7d773be0)
(Source: Cameco)
The BRR facility refines uranium concentrates (yellowcake) received from uranium mines worldwide to produce uranium trioxide (UO3), an intermediate product of the nuclear fuel cycle. The primary recipient of the UO3 is Cameco’s Port Hope Conversion Facility (PHCF).
In 2020, CNSC staff conducted 3 inspections at the BRR that covered 7 SCAs. Table B-1 in appendix B lists these inspections and the 4 resulting notices of non-compliance (NNCs) are highlighted in section 6 of this report.
CNSC staff are satisfied that Cameco’s BRR was operated safely in 2020 and in accordance with its licensing basis.
In September 2020, CNSC staff received Cameco’s application for a 10-year renewal of its fuel facility operating licence for BRR. BRR’s licence expired on February 28, 2022, and a Commission hearing took place on November 24, 2021. The Commission renewed the BRR licence for a 10-year period as per the Record of Decision.
2.2 Cameco Port Hope Conversion Facility
Cameco Corporation owns and operates the Port Hope Conversion Facility (PHCF), which is located in Port Hope, Ontario, situated on the north shore of Lake Ontario, approximately 100 km east of Toronto. Figure 2-2 shows an aerial view of the PHCF.
.png/object?subscription-key=3ff0910c6c54489abc34bc5b7d773be0)
(Source: Cameco)
PHCF converts UO3 powder produced by Cameco’s BRR into uranium dioxide (UO2) and uranium hexafluoride (UF6). UO2 is used in the manufacturing of Canada Deuterium Uranium (CANDU) reactor fuel, while UF6 is exported for further processing before being converted into fuel for light-water reactors.
In 2020, CNSC staff conducted 3 inspections at PHCF that covered 9 SCAs, as well as compliance verification activities associated with the Vision in Motion (VIM) project. Table B-2 of appendix B lists these inspections and the 8 resulting NNCs are highlighted in section 6 of report.
CNSC staff are satisfied that Cameco’s PHCF operated safely in 2020 and in accordance with its licensing basis.
Vision in motion
VIM is Cameco’s project to clean up and renew the site. The project is being carried out under Cameco’s operating licence FFOL-3631.00/2027. Licence condition 16.1 requires that "The licensee shall implement and maintain a program to carry out clean-up, decontamination and remediation work". Cameco postponed some non-essential VIM work to limit the amount of contractors onsite during the COVID-19 pandemic. In 2020, Cameco carried out VIM work that included:
- Preparation and transfer of stored wastes to the CNSC-licensed Canadian Nuclear Laboratories (CNL) Port Hope Project Long-Term Waste Management Facility
- Removal of interior equipment and accumulated waste materials in Building 27 (the former UF6 plant)
- Installation of infrastructure, including new storm water management systems and the new hydrogen station were substantially completed. Commissioning is planned for 2022. The Ontario Ministry of the Environment, Conservation and Parks environmental compliance approval amendment for stormwater was received and the new stormwater system at the south end of the facility began operation
- Conduct of species-at-risk desktop studies and species surveys in VIM work areas
- Conduct of a subsurface geotechnical drilling investigation in the location of proposed storm water infrastructure
In December 2020, Cameco provided an update to the Commission (CMD 20-M36.1) on the VIM project.
2.3 Cameco Fuel Manufacturing Inc.
Cameco Fuel Manufacturing Inc. (CFM) is a wholly owned subsidiary of Cameco Corporation. CFM operates 2 facilities: a nuclear fuel fabricating facility licensed by the CNSC in Port Hope, Ontario; and a metals manufacturing facility in Cobourg, Ontario, which manufactures fuel bundle and reactor components (non-nuclear activities). This latter facility is not licensed by the CNSC and is not discussed further in this report. Figure 2-3 shows an aerial view of the CFM facility.
.png/object?subscription-key=3ff0910c6c54489abc34bc5b7d773be0)
(Source: Cameco)
The CFM facility manufactures fuel pellets from natural UO2 powder and assembles nuclear reactor fuel bundles. The finished fuel bundles are primarily shipped to Canadian nuclear power reactors.
In 2020, CNSC staff conducted 3 inspections at CFM that covered 5 SCAs. Table B-3 of appendix B lists these inspections and the 9 resulting NNCs are highlighted in section 6 of this report.
CNSC staff are satisfied that CFM operated safely in 2020 and in accordance with its licensing basis.
In December 2020, CNSC staff received Cameco’s application for a 1-year renewal of its fuel facility operating licence for CFM that expired on February 28, 2022. The Commission conducted a hearing in writing to consider submissions from Cameco and CNSC staff, as well as interventions from the Public and Indigenous Nations and communities. The Commission granted CFM a 1-year licence renewal (February 28, 2023) as per the Record of Decision. CFM is currently applying for a 20-year licence renewal.
2.4 BWXT Nuclear Energy Canada Inc.
BWXT Nuclear Energy Canada Inc. (BWXT-NEC) produces nuclear fuel and fuel bundles used by Ontario Power Generation’s Pickering and Darlington nuclear generating stations. BWXT-NEC has licensed operations in 2 locations: Toronto and Peterborough, Ontario. Figures 2-4 and 2-5 show aerial views of the BWXT-NEC facilities.
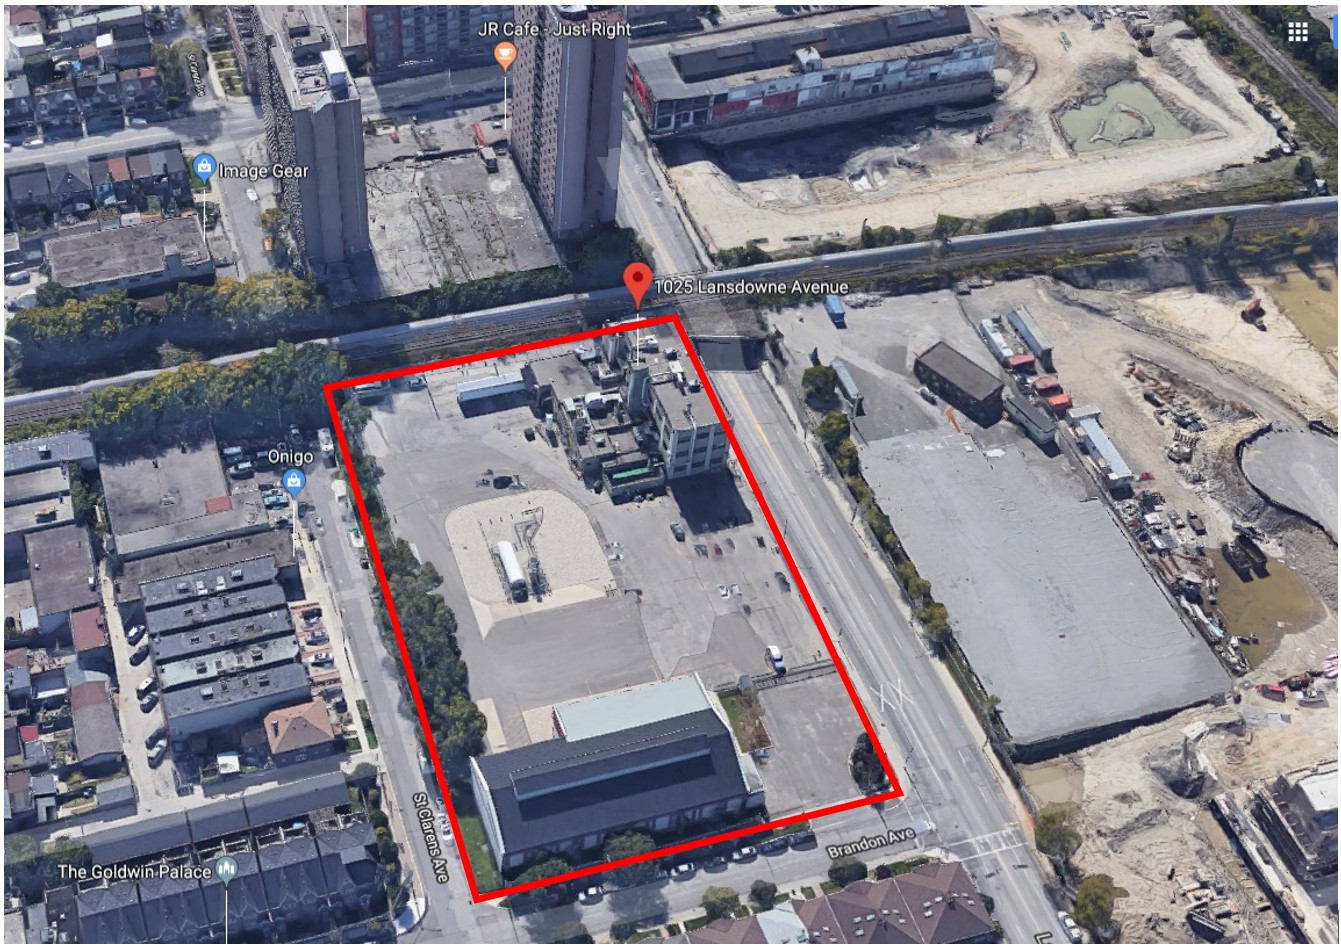
(Source: Google Maps)
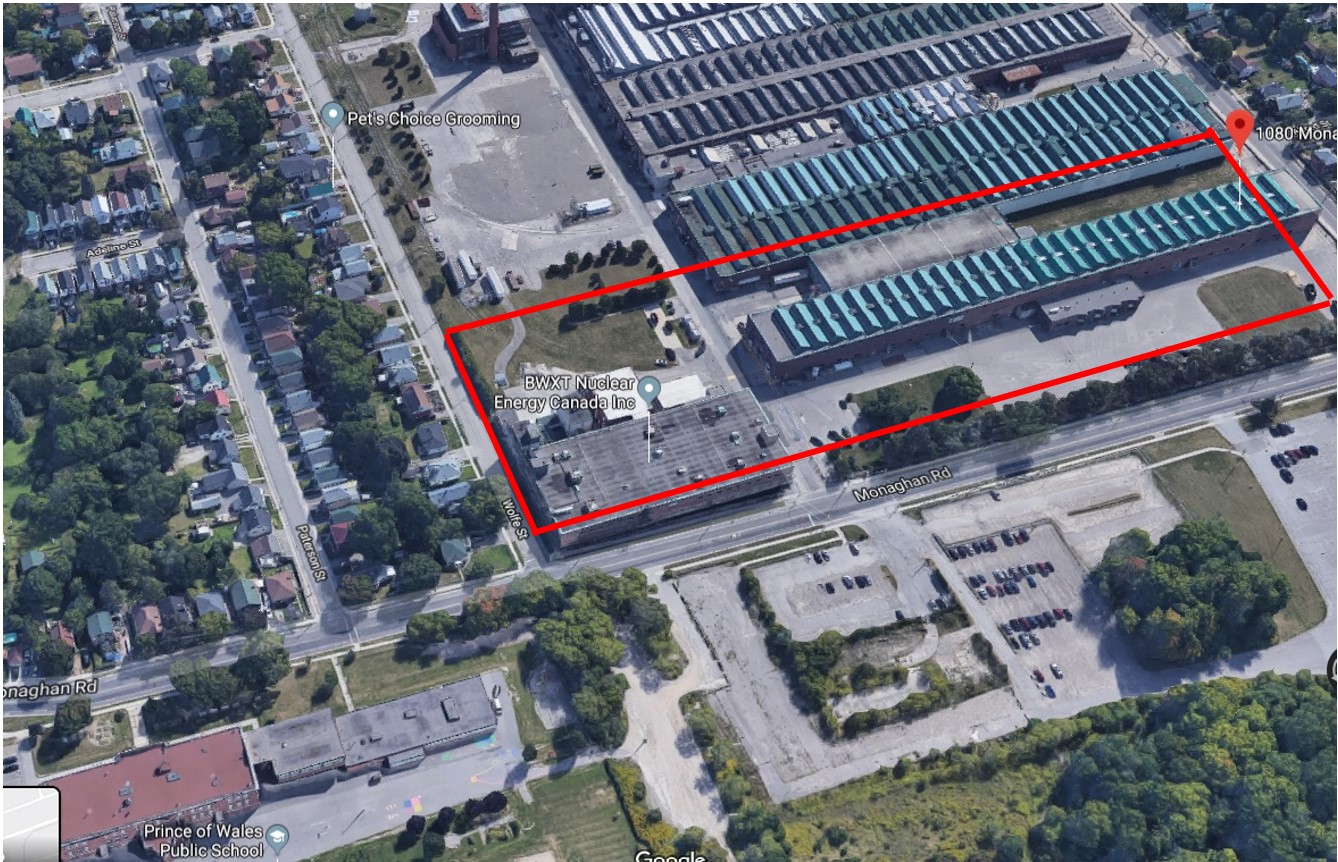
(Source: Google Maps)
The Toronto facility produces CANDU nuclear fuel pellets using UO2 supplied from the PHCF. The Peterborough facility manufactures CANDU nuclear fuel bundles, using the uranium pellets from Toronto and zircaloy tubes manufactured in-house. The Peterborough facility also runs a fuel services business involved with the manufacturing and maintenance of equipment for use in nuclear power plants.
In 2020, CNSC staff conducted 4 inspections at BWXT-NEC that covered 4 SCAs. Table B-4 of appendix B lists these inspections and the 4 resulting NNCs are highlighted in section 6 and section 7 of this report
Significant facility modifications included changes in Peterborough to include automation equipment dealing with sorting and stacking of fuel pellets received from the Toronto facility. All facility modifications were conducted under the facility change control process and CNSC staff are satisfied that the BWXT-NEC facilities operated safely in 2020 and in accordance with their licensing basis.
2.4.1 2020 BWXT-NEC Licence Renewal
In March 2020, the Commission conducted public hearings in Toronto, Ontario and Peterborough, Ontario on the renewal of BWXT-NEC’s operating licence. CNSC staff’s assessment of the renewal application was presented publicly during this hearing as CMD 20-H2.A and CMD 20-H2.B. As well, CNSC staff submitted CMD 20-H2.C in response to several undertakings provided to the Commission for more information.
In April 2020, the Commission announced a continuation of hearing and directed CNSC staff to collect additional soil samples of beryllium on properties adjacent to BWXT-NEC’s Peterborough facility. CNSC staff completed the resampling and provided a supplementary submission to the Commission as CMD 20-H2.D and CMD 20-H2.E.
In December 2020, the Commission made a decision on the BWXT-NEC licence renewal application as documented in the record of decision 20-H2. In its decision, the Commission decided to renew BWXT-NEC’s licence as 2 facility-specific licences (FFL-3621.00/2030 and FFL-3620.00/2030) for a period of 10 years. As the decision details, the Commission also permitted the conduct of pelleting operations at the Peterborough facility with conditions (e.g., updated safety analysis report and final commissioning report) and accepted BWXT-NEC’s proposed new financial guarantee. Further, the Commission issued several directions to CNSC staff on Indigenous and public engagement, the status of which is reported in sections 7.2 and 7.3 of this report.
3 Nuclear substance processing facilities
Nuclear substance processing facilities use nuclear substances to manufacture various products for end uses in industrial or medical applications. The nuclear substances can be used for lighting self-luminous emergency and exit signs, sterilizing items for sanitary reasons such as surgical gloves, and providing cancer diagnosis and treatment.
3.1 SRB Technologies (Canada) Inc.
SRB Technologies (Canada) Inc. (SRBT) operates a Class IB facility that manufactures gaseous tritium light sources, on the outskirts of Pembroke, Ontario, approximately 150 km northwest of Ottawa. The nuclear facility has been in operation since 1990 and employs approximately 40 employees. Figure 3-1 shows an aerial view of the SRBT facility.
.png/object?subscription-key=3ff0910c6c54489abc34bc5b7d773be0)
(Source: SRBT)
The SRBT facility produces sealed glass capsules coated with phosphorescent powder and filled with tritium gas to generate continuous light. Examples of gaseous tritium light sources made at the facility include signs, markers and tactical devices. SRBT distributes its products in Canada and internationally.
In 2020, CNSC staff conducted 2 inspections at SRBT that covered 2 SCAs. Table B-5 of appendix B lists these inspections and the 3 resulting NNCs are highlighted in section 6 of this report.
CNSC staff are satisfied that SRBT operated safely in 2020 and in accordance with its licensing basis.
CNSC staff were expecting to receive SRBT’s application for a nuclear substance processing facility licence in 2021, as it is due for renewal in June 2022.
3.2 Nordion (Canada) Inc.
Nordion (Canada) Inc. is located in Ottawa, Ontario, and is licensed to operate a Class IB nuclear substance processing facility. Figure 3-2 shows an aerial view of the Nordion facility.
.png/object?subscription-key=3ff0910c6c54489abc34bc5b7d773be0)
(Source: Google Maps)
The facility is composed of 2 major production operations. One operation involves the processing of radioisotopes used in nuclear medicine (medical isotopes) such as yttrium-90. The other operation involves manufacturing sealed sources (cobalt-60) used in cancer therapy and irradiation technologies (gamma technologies).
In April 2018, BWX Technologies Ltd. (BWXT) announced an agreement to acquire Nordion’s medical isotope business. The acquisition was completed in August 2018, as a wholly owned subsidiary of BWXT, BWXT Medical Ltd (BWXT-MED). Nordion continued to operate the medical isotope facility until BWXT-MED obtained a separate Class IB nuclear substance processing facility operating licence. The licensing hearing took place in June 2021 and BWXT-MED was issued a 10-year licence as per the Record of Decision.
In 2020, CNSC staff conducted 2 inspections at Nordion that covered 7 SCAs. Table B-6 of Appendix B lists these inspections and the 3 resulting NNCs are highlighted in section 6 of this report.
CNSC staff are satisfied that Nordion operated safely in 2020 and in accordance with its licensing basis.
3.3 Best Theratronics Ltd.
Best Theratronics Ltd. (BTL) owns and operates a medical device manufacturing facility in Ottawa, Ontario. Figure 3-3 shows an aerial view of the BTL facility.
.png/object?subscription-key=3ff0910c6c54489abc34bc5b7d773be0)
(Source: Google Maps)
BTL manufactures cyclotrons and medical equipment, including cobalt-60-based external beam radiation therapy units and cesium-137 self-contained irradiators for blood irradiation. BTL is licensed by the CNSC for the development and testing of cobalt‑60 teletherapy devices, the manufacturing of self-shielded irradiators, the storage of nuclear substances, and construction and testing of particle accelerators (cyclotrons) with beam energies ranging from 15 to 70 MeV.
In 2020, CNSC staff conducted 2 inspections at BTL that covered 2 SCAs. Table B-7 of appendix B lists these inspections and the 6 resulting NNCs are highlighted in section 6 of this report.
CNSC staff are satisfied that BTL operated safely in 2020 and in accordance with its licensing basis.
4 Research reactor facilities
This section discusses the CNSC’s regulatory oversight and licensee performance of small RRs in Canada, including the McMaster Nuclear Reactor (MNR) and 3 SLOWPOKE-2 reactors: Polytechnique Montréal, Saskatchewan Research Council (SRC) and Royal Military College of Canada (RMC).
CNSC staff first reported on nuclear research reactor (RR) facilities in 2015, in the Regulatory Oversight Report for Nuclear Processing, Small Research Reactor and Class 1B Accelerator Facilities: 2015. These facilities were then reported on again in 2018 during the ROR for Research Reactors and Class 1B Accelerators: 2016, and are now on a 3-year reporting frequency. This ROR covers reporting years 2018 to 2020. In 2021, for operational efficiency, CNSC staff decided to include RRs in this report, going forward.
The small RRs operating in Canada are designed to operate at low power, ranging from 0.02 megawatts (MW) for SLOWPOKE-2 reactors to 5 MW for the MNR. SLOWPOKE-2 reactors are self-limiting in power and temperature, without the need for operator intervention or automatic trip systems. They also use natural circulation for cooling, eliminating the need for complex cooling systems. These small RRs are typically used for academic purposes, medical isotope production, neutron radiography and neutron activation analysis for a number of industries including mining and geological surveys. Figure 4-1 shows a model of a SLOWPOKE-2 reactor core.
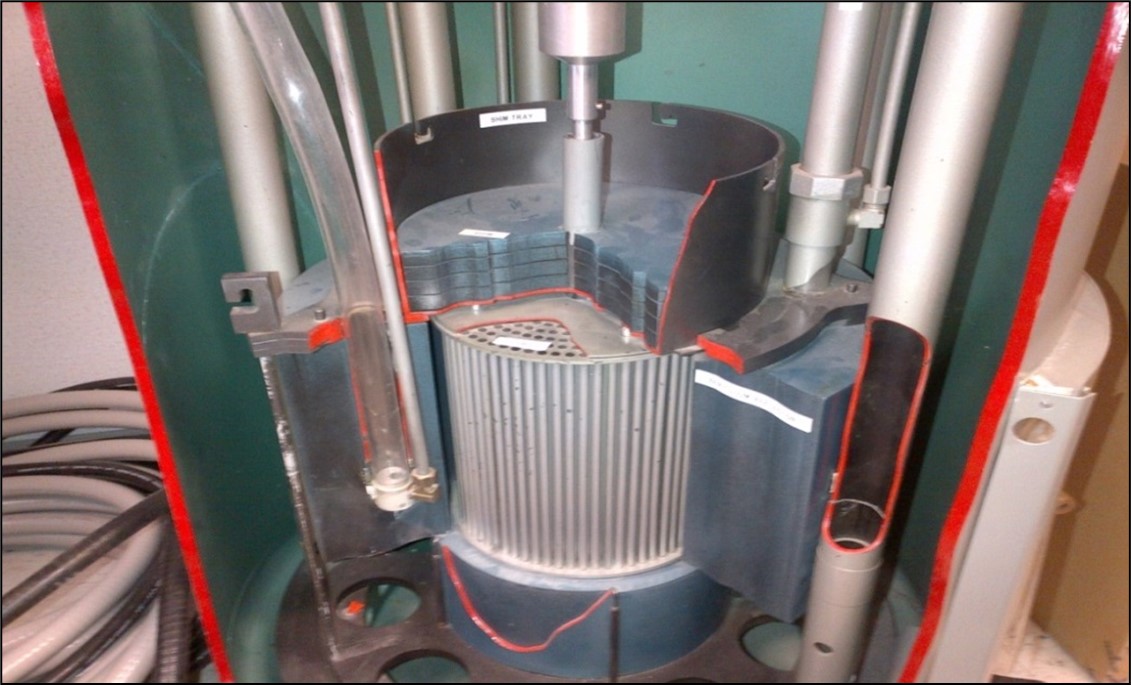
(Source: RMC)
They do not release liquid effluents, and their airborne releases are extremely small. A conservative evaluation of the dose to the public through airborne releases results in less than 1microsievert (μSv)/year, which is less than 1/1000 of the regulatory dose limit of 1 millisievert (mSv) for a member of the public. As a point of reference, the average effective dose to persons from natural background radiation in Canada is estimated at 1.8 mSv/year.
With their inherent safety characteristics and low power, these reactors present a very low risk.
4.1 Polytechnique Montréal SLOWPOKE-2
Polytechnique Montréal operates a SLOWPOKE-2 reactor in Montréal, Québec, for which a licence was issued by the CNSC in 2016, for a period of 7 years. The reactor was initially commissioned in 1976 and the fuel was replaced in 1997 with low enriched uranium (LEU) fuel. Polytechnique Montréal expects to operate the reactor until 2032. The reactor is used for research, neutron analysis, teaching and isotope production. The Polytechnique Montréal campus is shown in figure 4-2.
The Polytechnique Montréal SLOWPOKE-2 facility includes a subcritical assembly, located in a room next to the reactor. The assembly consists of natural uranium bars and neutron sources that are manually inserted into graphite blocks. The subcritical assembly has been used in the past for teaching and research purposes, but has not operated since 2012.
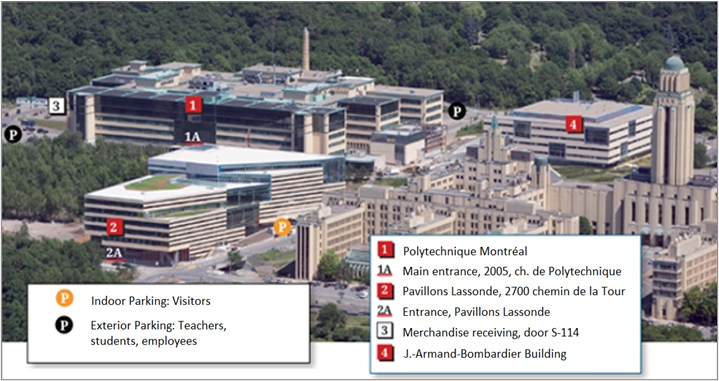
(Source: Polytechnique Montréal)
CNSC staff conducted 2 inspections at Polytechnique Montréal from 2018 to 2020 that covered 10 SCAs. Table B-8 of appendix B lists these inspections and the 4 resulting NNCs are highlighted in section 6 of this report.
CNSC staff are satisfied that Polytechnique Montréal operated safely over the 2018–20 period and in accordance with its licensing basis. No operational issues or events were reported over the 2018–20 period.
CNSC staff will be prepared to receive Polytechnique Montréal’s application for a SLOWPOKE-2 reactor operating licence in 2022, as it is due for renewal in July 2023.
4.2 McMaster Nuclear Reactor
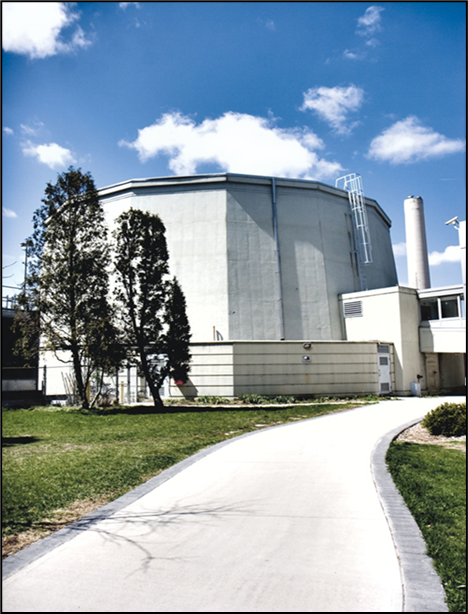
McMaster University operates the MNR, a medium flux reactor in Hamilton, Ontario. A licence was issued by the CNSC in 2014 for a period of 10 years. The reactor became operational in 1959, and it was upgraded in the 1970s to operate at 5 MW, up from the 1 MW maximum. The reactor is used for research, materials testing, teaching and isotope production.
This pool-type reactor uses LEU as fuel and has the added safety feature of a full containment building. The reactor produces iodine-125 for medical use in Canada and for international markets. The MNR is also used for neutron radiography, which is performed daily, for the testing of aircraft engine components. In addition to supporting the research work of McMaster University physics and engineering undergraduate and post-graduate students, the MNR is used for the irradiation of more than 10,000 mineral and other samples every year for various applications such as biomedical research, material science and geological surveys. Figure 4-3 shows an image of the MNR containment building, and figure 4-4 provides an overhead view of the MNR in operation.
(Source: McMaster University)
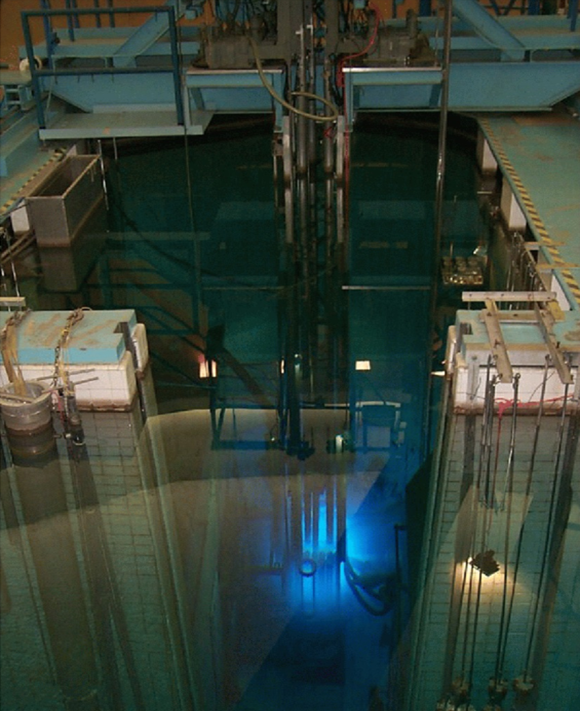
(Source: McMaster University)
From 2018 to 2020, CNSC staff conducted 3 inspections at the MNR, which covered 13 SCAs, as well as the public and information disclosure program. Table B-9 of appendix B lists these inspections and the 6 resulting NNCs are highlighted in section 6 of this report.
CNSC staff are satisfied that the MNR operated safely over the 2018–20 period and in accordance with its licensing basis.
4.3 Royal Military College of Canada SLOWPOKE-2
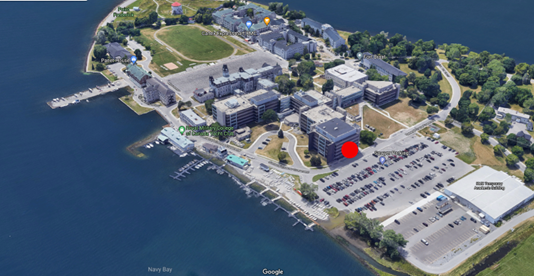
RMC operates a SLOWPOKE-2 facility, at the RMC complex in Kingston, Ontario. The licence was issued by the CNSC in 2013 for a period of 10 years.
This facility is made up of the reactor room, with the reactor and control room located on the first floor, and laboratories on the first and second floors of the Sawyer Science and Engineering Building, Module 5. This building is shown in figure 4-5, indicated by the red dot.
(Source: RMC)
This facility is used for neutron activation analysis, analysis of fissile materials, neutron radiography and radioscopy, and education in radiation protection at the post-graduate level. The reactor has been in operation since 1985, and the core is fueled with LEU.
The type of operations remained the same over the review period. RMC has undertaken a project to refuel the SLOWPOKE-2 reactor as the fuel core has attained its end of life, and the project is on schedule for completion by the end of 2021. CNSC staff are engaged in the review of the project and the refueling operations.
From 2018 to 2020, CNSC staff conducted 2 inspections at RMC, which covered 11 SCAs, along with the public information and disclosure program. Table B-10 of appendix B lists these inspections and the 2 resulting NNCs are highlighted in section 6 of this report.
CNSC staff are satisfied that RMC operated safely over the 2018–20 period and in accordance with its licensing basis.
CNSC staff will be prepared to receive RMC’s application for a SLOWPOKE-2 reactor operating licence in 2022, as it is due for renewal in July 2023.
4.4 Saskatchewan Research Council SLOWPOKE-2
SRC was operating the SLOWPOKE-2 facility, for which a 10-year licence was issued by the CNSC in 2013. The reactor came online in 1981, and was shut down for decommissioning in April 2019. In December 2019, following a public hearing, a licence amendment was approved by the Commission, allowing SRC to begin decommissioning.
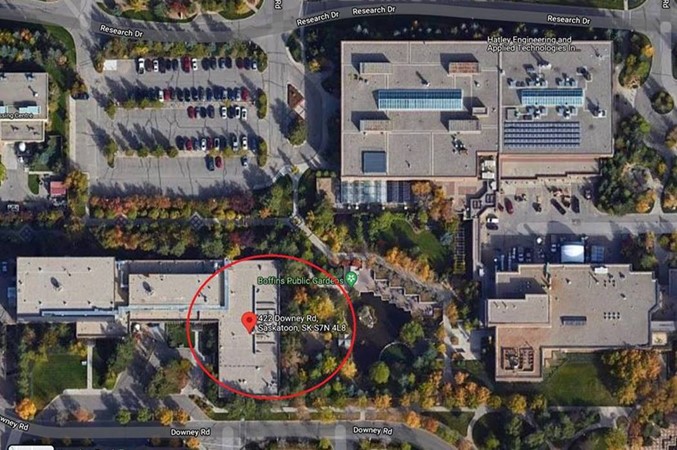
The SRC SLOWPOKE-2 facility was located within the Innovation Place Research Park in Saskatoon, Saskatchewan, as shown by the red circle in figure 4-6. Prior to decommissioning, the facility consisted of a reactor room, a laboratory and a waste storage room. The facility was used for neutron activation analysis, delayed neutron analysis and teaching in conjunction with the University of Saskatchewan.
(Source: Google Maps)
On August 15, 2019, the highly enriched uranium (HEU) fuel was removed from the reactor pool in the presence of representatives from the IAEA, CNSC and the United States Department of Energy (U.S. DOE). The HEU fuel was loaded into a transport flask and sealed by the IAEA for safeguards purposes, and was transported to the U.S. DOE’s Savannah River site in South Carolina.
CNSC staff conducted a remote Type II compliance inspection of SRC from July 8 to 10, 2020. The inspection verified that the decommissioning activities were conducted safely and in compliance with the NSCA, its associated Regulations, the licence, detailed decommissioning plan and supporting documentation. Figure 4-7 shows the SRC pool and overflow channels filled with grout, as part of the decommissioning activities.
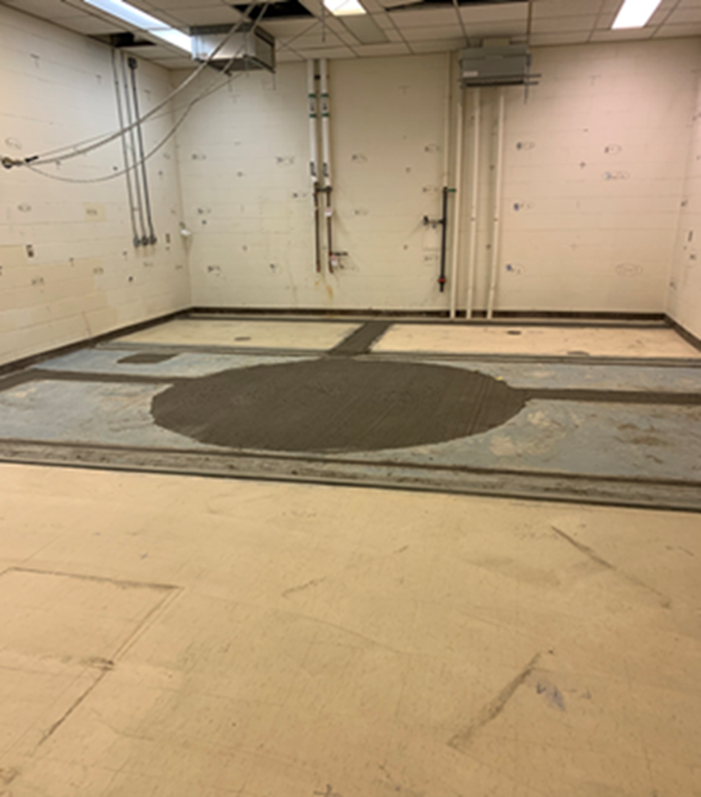
(Source: SRC)
As highlighted in section 6, CNSC staff raised 1 NNC with respect to waste characterization reports. This was resolved in the following weeks with the submission of additional waste characterization details and SRC’s end state report for the decommissioning of the SRC reactor facility.
SRC completed decommissioning activities in 2020. There are no nuclear activities, nuclear substances, equipment nor contamination above the unconditional release limits present in the building. The building can be repurposed for any non-nuclear activities without any restrictions. SRC have requested the revocation of the non-power reactor operating licence and requested a licence to abandon a nuclear facility on October 27, 2020.
On October 1, 2021, the Commission issued SRC a licence to abandon a non-power SLOWPOKE-2 reactor facility. The SRC SLOWPOKE-2 facility was released from CNSC regulatory control, and the financial guarantee held for the decommissioning of the facility was released.
In total, CNSC staff conducted 2 inspections at SRC from 2018 to 2020 that
covered 7 SCAs. Table B-11 of appendix B lists these inspections and the aforementioned NNC is highlighted in section 6 of this report.
CNSC staff are satisfied that SRC operated safely over the 2018–20 period and in accordance with its licensing basis.
5 CNSC regulatory oversight
The CNSC performs regulatory oversight of licensed facilities to verify compliance with the requirements of the NSCA and associated regulations made under the NSCA, each site’s licence and licence conditions, and any other applicable standards and regulatory documents.
CNSC staff use the SCA framework to assess, evaluate, review, verify and report on licensee performance. The SCA framework includes 14 SCAs, which are subdivided into specific areas that define its key components. Further information on the CNSC’s SCA framework can be found on the CNSC’s website.
5.1 Regulatory activities
CNSC staff conducted risk-informed regulatory oversight activities at Canada’s UNSPF (2020) and RRs (2018–20). Table 5-1 presents CNSC staff’s licensing and compliance verification efforts for these facilities for the reportable years. Of note is the high number for BWXT-NEC and SRC licensing activities. The BWXT-NEC person-days for licensing activities are higher due to licence renewal efforts for the Toronto and Peterborough facilities, while the SCR numbers were higher due to the decommissioning of the facility and the requested licence to abandon, as described in section 4.4 of this report.
| Facility type | Site | Number of inspections | Person-days for compliance verification activities | Person-days for licensing activities | Number of IAEA-initiated safeguards verification activities | Number of CNSC-initiated safeguards field activities |
|---|---|---|---|---|---|---|
| UNSPF | BRR | 3 | 243.10 | 92.67 | 7 | 0 |
| UNSPF | PHCF | 3 | 269.13 | 17.17 | 11 | 0 |
| UNSPF | CFM | 3 | 175.93 | 24.20 | 4 | 0 |
| UNSPF | BWXT-NEC | 4 | 247.33 | 525.73 | 10 | 0 |
| UNSPF | SRBT | 2 | 87.37 | 11.83 | 0 | 0 |
| UNSPF | Nordion | 2 | 124.33 | 0.73 | 0 | 0 |
| UNSPF | BTL | 2 | 160.10 | 6.53 | 0 | 0 |
| RRs | Polytechnique Montréal | 2 | 68.30 | 26.90 | 2 | 1 |
| RRs | MNR | 3 | 231.43 | 76.1 | 0 | 0 |
| RRs | RMC | 2 | 85.77 | 21.27 | 2 | 0 |
| RRs | SRC | 2 | 167.43 | 287.73 | 3 | 0 |
Compliance verification
The CNSC ensures licensee compliance through verification, enforcement and reporting activities. CNSC staff implement compliance plans for each site by conducting regulatory activities including inspections, desktop reviews and technical assessments of licensee programs, processes and reports.
Appendix B contains a list of CNSC inspections carried out at UNSPF and RRs for the applicable reporting periods, 2020 and 2018–20 respectively. All findings in these inspections were considered to be of low risk, and did not have an impact on safety at the facilities.
Although some SCAs were not the focus of inspections from 2018–20, CNSC staff performed desktop compliance verification of the various SCAs by reviewing licensees’ compliance reporting submissions (such as annual and quarterly compliance monitoring reports) and specific program documentation.
Licensing
CNSC staff activities for licensing include drafting new or amended licences, preparing CMDs, and drafting or revising licence conditions handbooks (LCHs).
As CNSC regulatory documents are published, CNSC staff update the LCHs as applicable for each site, taking into consideration the licensee’s implementation plans. Appendix C provides a list of changes to uranium and nuclear substance processing facility and RR licences and LCHs. CNSC staff verify the implementation as part of ongoing compliance verification activities. Appendix D provides a list of CNSC regulatory documents implemented at UNSPF and RRs and used by CNSC staff for compliance verification. Appendix E presents the financial guarantee amounts for each facility.
IAEA safeguards activities
Under the terms of the Canada–IAEA safeguards agreements, the IAEA performs verification activities to confirm that all nuclear material in Canada remains in peaceful use. The CNSC regulatory framework requires Canadian operators to provide the access, assistance, and information required for the IAEA to complete its activities. CNSC staff ensure operator compliance with these requirements.
5.2 Performance Ratings for 2020
CNSC staff assign performance ratings to licensees based on the results from regulatory oversight activities.
These ratings are either "satisfactory" (SA) or "below expectations" (BE) for the UNSPF (2020) and RRs (2018–20). The "fully satisfactory" (FS) rating is no longer in use. It is important to recognize that a rating of SA in the current ROR instead of FS used in a previous ROR does not indicate a reduction in performance. In 2020, the Commission agreed with the use of this simplified ratings approach for the RORs [2], which is consistent with the CNSC’s effort to implement neutral, fair regulatory oversight. This revised system has allowed CNSC staff to focus on facilities’ performance.
For 2020, CNSC staff rated the performance in each SCA as "satisfactory" (SA) for all UNSPF and RRs. Appendix F provides SCA ratings for each licensee from 2016 to 2020.
6 The CNSC’s assessment of safety at uranium and nuclear substance processing facilities and research reactors
The CNSC regulates all aspects of safety at nuclear sites in Canada, including risks to workers, the public and the environment. All 14 SCAs, discussed in the following paragraphs, are assessed. Detailed information is provided on radiation protection, conventional health and safety, and environmental protection, since these 3 SCAs are considered the most indicative of safety performance at the UNSFP and RRs. In particular, the SCAs of radiation protection and conventional health and safety are a good measure of the safety of workers, while the SCA of environmental protection is an appropriate measure with respect to the safety of people and the environment.
6.1 Management System
The management system SCA covers the framework that establishes the processes and programs required to ensure that an organization achieves its safety objectives, continuously monitors its performance against these objectives, and fosters a healthy safety culture.
CNSC staff assess performance in the management system SCA by verifying compliance of licensee documents and programs through desktop reviews and through compliance verification inspections that are planned or reactive. The specific areas assessed within the management system include organization, planning and controlling business activities, resource management, communication, safety culture, change management, information management, work management, problem identification and resolution, performance assessment, improvement, and management review.
NNCs from inspections related to the management system SCA were issued for the following licensees over the reporting period:
- 1 NNC at Nordion, based on implementation measures to ensure records are complete and traceable in accordance with CSA standard N286-12, Management Systems for Nuclear Facilities [3]
- 2 NNCs at BTL, based on the accessibility of records related to facility maintenance and their approved supplier list
- 1 NNC at Polytechnique Montréal in 2020, relating to the timely implementation of corrective actions
The licensees have taken all necessary corrective actions to address the above noted NNCs. The findings were of low safety significance and did not affect the health and safety of workers, people and the environment, or the safe operation of the facility.
CNSC staff concluded that the UNSPF and RRs met regulatory requirements and maintained and implemented satisfactory management system programs for the applicable reportable years. CNSC staff will continue to monitor performance through regulatory oversight activities pertaining to this SCA.
6.2 Human Performance Management
The human performance management SCA covers activities that enable effective human performance through the development and implementation of processes that ensure a sufficient number of licensee personnel are in all relevant job areas and have the necessary knowledge, skills, procedures and tools in place to safely carry on their duties.
CNSC staff assess performance in the human performance management SCA by verifying compliance of licensee documents and programs through desktop reviews and through compliance verification inspections that are planned or reactive. For this SCA, CNSC staff verify that licensees are in compliance with REGDOC-2.2.2, Personnel Training [4], and their documented personnel training programs.
NNCs from inspections related to the human performance management SCA were issued for the following licensees over the reporting period:
- 1 NNC at BRR, on the documentation related to the systematic approach to training (SAT) implemented onsite
- 3 NNCs at SRBT, based on findings related to the SAT-based personnel training program
- 4 NNCs at BTL, related to training requirements for SAT-based positions
- 1 NNC at MNR, related to the training and qualification plan for the MNR Emergency Organization in 2018
- 3 NNCs at the MNR, related to program documentation in 2020, which was assessed for the first time against the requirements of REGDOC-2.2.2, Personnel Training [4]
The licensees have taken all necessary corrective actions to address the above noted NNCs. The findings were of low safety significance and did not affect the health and safety of workers, people and the environment, or the safe operation of the facility.
CNSC staff concluded that the UNSPF and RRs implemented and maintained effective programs specific to personnel training and met regulatory requirements. CNSC staff will continue to verify that licensees are in compliance with the requirements for their programs and procedures, as part of ongoing regulatory oversight activities.
6.3 Operating Performance
The operating performance SCA includes an overall review of the conduct of the licensed activities and the activities that enable effective performance.
CNSC staff assess performance in the operating performance SCA by verifying that policies, programs, methods and procedures are in place for the safe operation and maintenance of nuclear facilities. Verification of compliance with the requirements of this SCA are included as part of CNSC’s compliance verification activities ranging from desktop reviews of annual reports, reviews of event reports, related corrective actions, and planned or reactive inspections.
NNC from inspections related to the operating performance SCA were issued for the following licensee over the reporting period:
- 1 NNC at Nordion, based on implementation measures to ensure that events are reported to the CNSC in accordance with REGDOC-3.1.2, Reporting Requirements for Non-Power Reactor Class I Nuclear Facilities and Uranium Mines and Mills [5]
The licensee has taken all necessary corrective actions to address the above noted NNC. The finding was of low safety significance and did not affect the health and safety of workers, people and the environment, or the safe operation of the facility.
CNSC staff concluded, through compliance verification activities, that UNSPF and RRs implemented and maintained effective operating programs in order to ensure that licensed activities are conducted safely and in compliance with regulatory requirements. CNSC staff will continue to monitor licensee performance through regulatory oversight activities pertaining to this SCA.
6.4 Safety analysis
The safety analysis SCA covers the maintenance of the safety analysis that supports the overall safety case for the facility. Safety analysis is a systematic evaluation of the potential hazards associated with the conduct of a proposed activity or facility and considers the effectiveness of preventative measures and strategies in reducing the effects of such hazards.
CNSC staff assess performance in the safety analysis SCA by verifying compliance of licensee documents and programs through desktop reviews and through compliance verification inspections that are planned or reactive. CNSC staff verify that licensees maintain safety analysis reports (SARs) to include updated information on the description of the facility and the measures in place to protect the safety of the workers, the public and the environment, under normal operations, abnormal operations and accident conditions. CNSC staff asses the SARs to ensure they provide an assessment of the potential consequences and demonstrate the safety case through defence in depth.
For inspections related to the safety analysis SCA over the reporting period, all licensees were found to be compliant. CNSC staff concluded that the UNSPF and RRs met regulatory requirements and maintained satisfactory ratings in the safety analysis SCA for the applicable reportable years. CNSC staff will continue to monitor performance through regulatory oversight activities pertaining to this SCA.
6.5 Physical design
The physical design SCA relates to activities that impact the ability of structures, systems and components to meet and maintain their design basis given new information arising over time and taking changes in the external environment into account.
CNSC staff assess performance in the physical design SCA by verifying compliance of licensee documents and programs through desktop reviews and through compliance verification inspections that are planned or reactive. CNSC staff verify the physical design SCA requirements by ensuring the implementation of national codes and standards for structural design and maintaining authorized inspection agency formal agreements including pressure-retaining programs where applicable.
NNCs from inspections related to the physical design SCA were issued for the following licensee over the reporting period:
- 2 NNCs at the PHCF, related to updating and implementing documentation for the pressure boundary program
The licensee has taken all necessary corrective actions to address the above noted NNCs. The findings were of low safety significance and did not affect the health and safety of workers, people and the environment, or the safe operation of the facility.
CNSC staff concluded that the UNSPF and RRs met regulatory requirements and maintained satisfactory ratings in the physical design SCA for the applicable reportable years. CNSC staff will continue to monitor performance through regulatory oversight activities pertaining to this SCA.
6.6 Fitness for service
The fitness for service SCA covers activities that impact the physical condition of structures, systems and components to ensure that they remain effective over time. This area includes programs that verify all equipment is available to perform its intended design function when called upon to do so.
CNSC staff assess performance in the fitness for service SCA by verifying compliance of licensee documents and programs through desktop reviews and through compliance verification inspections that are planned or reactive. CNSC staff verify that the programs cover activities that affect the physical condition of structures, systems and components over time. Specific areas are assessed within this SCA to ensure that the fitness for service programs are supported by detailed procedures on preventative maintenance, measuring and testing of equipment and new equipment validation.
NNC from inspections related to the fitness for service SCA were issued for the following licensee over the reporting period:
- 1 NNC at CFM, related to the completion of scheduled gauge verifications
The licensee has taken all necessary corrective actions to address the above-noted NNC. The finding was of low safety significance and did not affect the health and safety of workers, people and the environment, or the safe operation of the facility.
CNSC staff concluded that the UNSPF and RRs met regulatory requirements and maintained satisfactory ratings in the fitness for service SCA for the applicable reportable years. CNSC staff will continue to monitor performance through regulatory oversight activities pertaining to this SCA.
6.7 Environmental protection
Protection of the environment and the public are linked in the SCA of environmental protection. This SCA covers programs that identify, control and monitor all releases of radioactive and hazardous substances, and the effects on the environment from facilities or as a result of licensed activities.
NNCs from inspections related to the environmental protection SCA were issued for the following licensees over the reporting period:
- 1 NNC at PHCF, related to conducting documented visual inspections of the cooling water intake operating system and related fish barriers to ensure that existing mitigation measures remain effective at reducing and/or preventing fish impingement and entrainment
- 1 NNC at CFM, based on a finding related to fenceline gamma monitoring.
The licensees have taken all necessary corrective actions to address the above noted NNCs. The findings were of low safety significance and did not affect the health and safety of workers, people and the environment, or the safe operation of the facility
Currently, all licensees covered by this ROR have acceptable environmental protection programs in place to ensure the protection of the public and the environment. CNSC staff rated the environmental protection SCA at all UNSPF and RRs as "satisfactory".
Appendix G provides the total annual releases of radionuclides for the UNSPF and RRs from 2016 to 2020. Appendix H contains data on dose to the public from 2016 to 2020. Appendix I contains supplemental environmental data for all licensees.
Effluent and emissions control (releases)
All UNSPF and RRs implement effluent monitoring programs commensurate with the risks of their operations. Airborne and waterborne releases of radioactive and hazardous substances at UNSPF and RRs remained below regulatory limits in 2020.
Action levels
Action levels are a tool used to ensure that licensees are operating their facility appropriately and in accordance with their approved program(s) and within the design and operational parameters of their wastewater treatment and air pollution control systems.
Action levels serve as an early warning system to ensure that licensees are carefully monitoring their operation and performance, to ensure release limits are not exceeded. Action level exceedances are reportable to the CNSC.
Each licensee is responsible for identifying the parameters of its own program(s) to represent timely indicators of potential losses of control of the program(s). These licensee-specific action levels may also change over time, depending on operational and radiological conditions.
If an action level is reached, it triggers the licensee to determine the cause, notify the CNSC and, if applicable, take corrective action to restore the effectiveness of the environmental protection program. It is important to note that occasional action level exceedances indicate that the action level chosen is likely an adequately sensitive indicator of a potential loss of control of the program.
Licensee performance is not evaluated solely on the number of action level exceedances in a given period, but also on how the licensee responds and implements corrective actions to enhance program performance and prevent reoccurrence. Licensees are required to periodically review their action levels to validate their effectiveness.
The following environmental action level exceedances were reported to the CNSC:
- On March 13, 2020, 1 action level exceedance occurred at the PHCF, where the uranium concentration (160 μg U/L) exceeded the sanitary sewer discharge action level (100 μg U/L). This occurrence was due to groundwater infiltration from a heavy precipitation event. Cameco has implemented corrective actions and are continuing to repair and upgrade sections of the sanitary sewer network as part of the VIM project.
- On July 13, 2020, a burnout of a fluorine inlet valve resulted in an elevated fluoride emission of 273 grams/hr which exceeded the action level of 230 g/hr. Cameco’s uranium hexafluoride plant was shut down immediately. The fluorine inlet valve was replaced and the plant was restarted the following day.
- On April 30 and May 31, 2020, the fenceline gamma action level at station 31 was exceeded on 2 occasions. The April and May gamma radiation measurements were 0.28 and 0.26 uSv/hr respectively, which exceeded the action level of 0.22 uSv/hr. Cameco’s investigation determined that the exceedances were due to uranium hexafluoride cylinder storage in the area. Cameco reviewed and adjusted the cylinder storage in the area to reduce exposures.
- On March 17, 2021, BWXT-NEC Toronto reported that they had been applying the release limits for pH (6.0–9.5) set by the City of Toronto sewer use bylaw which is less restrictive than their CNSC-accepted action levels for liquid effluent (6.65–9.0). As a result, there were 27 instances of exceedances of the lower pH action level. The exceedances were in the range of 6.01–6.63, with 26 exceedances occurring in 2020 and 1 exceedance in 2019.
None of the releases exceeded the City of Toronto sewer use bylaw (6.0–9.5) requirements and there were no potential environmental impacts associated with these exceedances. An investigation was completed and corrective actions were identified. CNSC staff are in the process of reviewing the corrective actions submitted by the licensee.
CNSC staff have assessed that there was no impact to workers, the public or the environment as a result of these action level exceedances. CNSC staff reviewed the licensees’ corrective actions in relation to the exceedances and are satisfied with the licensee’s responses.
Environmental management system
The CNSC requires each licensee to develop and maintain an environmental management systems (EMS) that provide a framework for integrated activities related to environmental protection. EMS are described in environmental management programs and include activities such as the establishment of annual environmental objectives, goals and targets. Licensees conduct internal audits of their programs at least once a year. As part of regular compliance verification, CNSC staff review and assess these objectives, goals and targets. CNSC staff determined that the UNSPF and RRs established and implemented their EMS in compliance with CNSC regulatory requirements.
Assessment and monitoring
CNSC staff verify that UNSPF and RRs have environmental monitoring programs commensurate with the risks of the operations at each of their facilities. The environmental monitoring programs are designed to monitor releases of radioactive and hazardous substances, and to characterize the quality of the environment associated with the licensed facility. CNSC staff determined that the UNSPF and RRs established and implemented environmental monitoring programs in compliance with CNSC regulatory requirements where applicable.
Environmental risk assessment
Licensees develop environmental risk assessments (ERAs) to analyze the risks associated with contaminants in the environment as a result of licensed activities. ERAs provide the basis for the scope and complexity of environmental monitoring programs at the UNSPF and RRs.
ERAs for UNSPF
CNSC staff use CSA standard N288.6-12, Environmental Risk Assessments at Class I Nuclear Facilities and Uranium Mines and Mills [6], to help determine whether licensees are in compliance with regulatory requirements for protection of the environment and human health. CSA N288.6-12 specifically states: "Facility ERAs should be reviewed on a 5-year cycle or more frequently if major facility changes are proposed that would trigger a predictive assessment". CNSC staff expect licensees to periodically review ERAs for their facilities, as appropriate. BRR, CFM, and SRBT submitted revised ERAs in 2020 that were in compliance with CSA N288.6-12 [6].
ERAs for RRs
As part of the 2013 licence renewal of the SLOWPOKE-2 facilities, CNSC staff completed a sector specific environmental risk assessment to determine potential impacts to human health and the environment as a result of the operations of the SLOWPOKE-2 facilities. In CNSC staff's assessment, the maximum dose to members of the public that was estimated under normal operations was 0.08 μSv/year. This is several orders of magnitude below the regulatory public dose limit of 1 mSv/yr (1000 μSv/year). In addition, CNSC staff assessed the dose rates to non-human ecological receptors, and the results were orders of magnitude lower than conservative benchmarks. For the MNR, a conservative evaluation of the dose to the public through airborne releases results in less than 1 μSv/year, which is less than 1/1000 of the regulatory dose limit of 1 mSv for a member of the public. In light of these results, no impacts to human health and the environment are expected from the normal operation of RR facilities in Canada.
Protection of people
The CNSC requires licensees to demonstrate that the health and safety of the public are protected from exposures to hazardous (non-radiological) substances released from their facilities. Licensees use effluent and environmental monitoring programs to verify that releases of hazardous substances do not result in environmental concentrations that may affect public health. CNSC staff receive reports of discharges to the environment in accordance with reporting requirements outlined in the licence and the LCH. Based on assessments of the programs at the uranium and nuclear substance processing facilities, CNSC staff concluded that the public continues to be protected from facility emissions of hazardous substances.
Estimated dose to the public
The maximum dose to the public from licensed activities is calculated by considering monitoring results from air emissions, liquid effluent releases and gamma radiation. The CNSC requires licensees to monitor their facilities and keep doses to the public below the annual public dose limit of 1 mSv/year prescribed in the Radiation Protection Regulations [8]. This requirement is in line with the principle that licensees must keep doses as low as reasonably achievable (ALARA), taking into account social and economic factors.
Table H-1 of Appendix H compares estimated public doses from 2016 to 2020 for the UNSPF and RRs. Estimated doses to the public from all these facilities continued to be well below the regulatory annual public dose limit of 1 mSv/year.
Conclusion on environmental protection
CNSC staff concluded that the UNSPF and RRs implemented their environmental protection programs satisfactorily for the applicable reportable years. The licensees’ programs are effective in protecting the health and safety of people and the environment. CNSC staff will continue to monitor performance through regulatory oversight activities pertaining to this SCA.
6.8 Radiation protection
The radiation protection SCA covers the implementation of a radiation protection program in accordance with the Radiation Protection Regulations [8]. The program must ensure that contamination levels and radiation doses received by individuals are monitored, controlled and maintained ALARA.
NNCs from inspections related to the radiation protection SCA were issued for the following licensees over the reporting period:
- 1 NNC at BRR related to the implementation of measures to ensure employees, contractors, and visitors adhere to whole body monitoring protocols
- 2 NNCs at CFM based on findings related to radiation warning signage
The licensees have taken all necessary corrective actions to address the above noted NNCs. The findings were of low safety significance and did not affect the health and safety of workers, people and the environment, or the safe operation of the facility. CNSC staff rated the radiation protection SCA at all UNSPF and RRs as "satisfactory".
Appendix J contains data on dose to workers for the UNSPF and RRs from 2016 to 2020.
Application of ALARA
CNSC staff confirmed that all UNSPF and RRs continued to implement radiation protection measures to keep radiation exposures and doses to persons ALARA. The CNSC requirement for licensees to apply the ALARA principle has consistently resulted in these doses staying well below regulatory dose limits.
Worker dose control
The design of radiation protection programs includes the dosimetry methods and the determination of workers who are identified as nuclear energy workers (NEWs). These designs vary, depending on the radiological hazards present and the expected magnitude of doses received by workers. The dose statistics provided in this report are primarily for NEWs, with the inherent differences in the design of radiation protection programs among licensees taken into consideration. Additional information on the total number of monitored persons, including workers, contractors and visitors, is provided in Appendix J. CNSC staff confirmed that all UNSPF and RRs monitored and controlled the radiation exposures and doses received by all persons present at their licensed facilities, including workers, contractors and visitors. Direct comparison of doses received by NEWs among facilities does not necessarily provide an appropriate measure of a licensee’s effectiveness in implementing its radiation protection program, since radiological hazards differ across these facilities due to complex and varying work environments.
Radiation protection program performance
CNSC staff conducted regulatory oversight activities at UNSPF and RRs to verify that the licensees’ radiation protection programs complied with regulatory requirements. These oversight activities included inspections, desktop reviews, and compliance verification activities specific to radiation protection. Through these activities, CNSC staff confirmed that all these licensees have effectively implemented their radiation protection programs, to control occupational exposures to workers and keep doses ALARA.
Action levels
The following radiation protection action level exceedance was reported to the CNSC:
- In July 2020 at BRR, a worker’s dosimeter recorded a skin dose of 26.4 mSv, which exceeded Cameco’s monthly skin dose action level of 15 mSv. Cameco’s investigation determined that the dose was mostly non-personal, as the dosimeter was lost for a period of time in a processing area. A dose change request was pursued by Cameco and approved by the CNSC. CNSC staff are satisfied with Cameco’s responses to the action level exceedance.
Radiological hazard control
CNSC staff verified that UNSPF and RRs continued to implement adequate measures to monitor and control radiological hazards in their facilities. These measures included delineation of zones for contamination control purposes and in-plant air-monitoring systems. Licensees demonstrated that they have implemented workplace monitoring programs to protect workers. The licensees have also demonstrated that levels of radioactive contamination were controlled within their facilities throughout the year.
Conclusion on radiation protection
CNSC staff concluded that the UNSPF and RRs effectively implemented and maintained their radiation protection programs for the applicable reportable years. The licensees’ programs are effective in ensuring the health and safety of persons working in their facilities. CNSC staff will continue to monitor performance through regulatory oversight activities pertaining to this SCA.
6.9 Conventional health and safety
The conventional health and safety SCA covers the implementation of a program to manage workplace safety hazards and to protect workers.
Based on regulatory oversight activities, CNSC staff rated the performance of all UNSPF (2020) and RRs (2018–20) for the conventional health and safety SCA as "satisfactory".
Appendix K contains health and safety information for each UNSPF and RR from 2016 to 2020.
Performance
Employment and Social Development Canada (ESDC) and the CNSC regulate conventional health and safety programs at UNSPF and RRs. Licensees submit hazardous-occurrence investigation reports to both ESDC and the CNSC, in accordance with their respective reporting requirements. CNSC staff monitor compliance with regulatory reporting requirements and, when a concern is identified, consult with ESDC staff.
Licensees are required to report to the CNSC as directed by section 29 of the General Nuclear Safety and Control Regulations [9]. These reports include serious illnesses or injuries incurred or possibly incurred as a result of a licensed activity.
A key performance measure for the conventional health and safety SCA is the number of lost-time injuries (LTIs) that occur per year. An LTI is an injury that takes place at work and results in the worker being unable to return to work to carry out their duties for a period of time. There were no LTIs at the UNSPF in 2020 or the RRs from 2018–20.
Practices
Licensees are responsible for developing and implementing conventional health and safety programs for the protection of their workers. These programs must comply with Part II of the Canada Labour Code [10].
CNSC staff conducted desktop reviews and inspections at all UNSPF (2020) and RRs (2018–20) to verify compliance of the licensees’ conventional health and safety programs with regulatory requirements.
NNCs from inspections related to the conventional health and safety SCA were issued for the following licensees over the reporting period:
- 1 NNC at PHCF, related to ensuring that employees are alerted when mandatory training is missed, and that measures are taken to reduce or eliminate non-conformance with training requirements
- 3 NNCs at CFM, related to non-radiological workplace hazard signage, personnel roles and responsibilities documentation, and legibility of lockout tags used for the control of hazardous energy
The licensees have taken all necessary corrective actions to address the above-noted NNCs. The findings were of low safety significance and did not affect the health and safety of workers, people and the environment, or the safe operation of the facility.
CNSC staff concluded, based on regulatory oversight activities, that the UNSPF and RRs met all regulatory requirements for this specific area.
Awareness
Licensees are responsible for ensuring that workers have the knowledge to identify workplace hazards and take the necessary precautions to protect against these hazards. This is accomplished through training and ongoing internal communications with workers.
During inspections, CNSC staff verify that workers are trained to identify hazards at the facilities. CNSC staff confirmed that UNSPF and RRs have effectively implemented their conventional health and safety programs to keep workers safe.
Conclusion on conventional health and safety
CNSC staff concluded that the UNSPF and RRs implemented their conventional health and safety programs satisfactorily for the applicable reportable years. The programs are effective in protecting the health and safety of persons working in these facilities. CNSC staff will continue to monitor performance through regulatory oversight activities pertaining to this SCA.
6.10 Emergency management and fire protection
The emergency management and fire protection SCA covers emergency plans and emergency preparedness programs that exist for emergencies and for non-routine conditions.
CNSC staff assess performance in the emergency management and fire protection SCA by verifying compliance of licensee documents and programs with requirements. This is done through desktop reviews as well as compliance verification inspections that are planned or reactive. Specific areas assessed within this SCA include how licensees respond to conventional and nuclear events, both onsite and offsite, and events that can affect the facility. CNSC staff ensure that comprehensive fire protection programs are also in place to minimize the risk to the health and safety of persons and to the environment from fire, through appropriate fire protection system design, fire safety analysis, fire safe operation and fire prevention.
NNCs from inspections related to the Emergency Management and Fire Protection SCA were issued for the following licensees over the reporting period:
- 1 NNC at the PHCF, related to the placement of an emergency exit sign
- 2 NNCs at the MNR in 2018, regarding documentation of the emergency management program
The licensees have taken all necessary corrective actions to address the above noted NNCs. The findings were of low safety significance and did not affect the health and safety of workers, people and the environment, or the safe operation of the facility.
CNSC staff concluded that the UNSPF and RRs met regulatory requirements and maintained satisfactory ratings in the emergency management and fire protection SCA for the applicable reportable years. CNSC staff will continue to monitor performance through regulatory oversight activities pertaining to this SCA.
6.11 Waste management
The waste management SCA covers internal waste-related programs that form part of the facility’s operations up to the point where the waste is removed from the facility to a separate waste management facility. This SCA also covers the planning for decommissioning.
CNSC staff assess performance in the waste management SCA by verifying compliance of licensee documents and programs through desktop reviews and through compliance verification inspections that are planned or reactive. CNSC staff ensure that the licensees properly manage wastes throughout the lifecycle of a nuclear facility, which includes the maintenance of an up-to-date waste inventory and waste tracking. The CNSC requires that licensees have a decommissioning plan and financial guarantee to ensure that the health, safety, and security of workers, the public, and the environment remains protected.
NNCs from inspections related to the waste management SCA were issued for the following licensees over the reporting period:
- 1 NNC at Nordion related to waste inventory record keeping
- 1 NNC at SRC during the 2020 decommissioning inspection to provide characterization reports of the waste to the CNSC
The licensees have taken all necessary corrective actions to address the above noted NNCs. The findings were of low safety significance and did not affect the health and safety of workers, people or the environment, or the safe operation of the facilities.
CNSC staff concluded that the UNSPF and RRs met regulatory requirements, and maintained and implemented satisfactory waste management programs for the applicable reportable years. CNSC staff will continue to monitor performance through regulatory oversight activities pertaining to this SCA.
6.12 Security
The security SCA covers the programs required to implement and support the security requirements stipulated in the regulations, the licence, orders, or expectations for the facility or activity.
CNSC staff assess performance in the security SCA by verifying compliance of licensee documents and programs through desktop reviews and through compliance verification inspections that are planned or reactive. Specific areas assessed within this SCA include programs and procedures relating to access control, response arrangements, security practices, cyber security and drills and exercises. CNSC staff ensure that the security programs in place prevent the loss, unauthorized removal and sabotage of nuclear substances, nuclear materials, prescribed equipment and information.
Security inspections and details of security arrangements with the licensees are confidential. NNCs from inspections related to the security SCA were issued for the following licensees over the reporting period:
- 2 NNCs at PHCF
- 2 NNCs at CFM
- 1 NNC at BWXT-NEC Peterborough
- 3 NNCs at Polytechnique Montréal in 2019
- 2 NNCs at RMC in 2019
The licensees have taken corrective actions to address the above noted NNCs, and most have been addressed. Remaining items are scheduled for completion in 2021, subject to limitations associated with the COVID-19 pandemic. The findings were of low safety significance and did not affect the health and safety of workers, people and the environment, or the safe operation of the facility.
CNSC staff concluded that the UNSPF and RRs met regulatory requirements and maintained and implemented satisfactory security programs for the applicable reportable years. CNSC staff will continue to monitor performance through regulatory oversight activities pertaining to this SCA.
6.13 Safeguards and non-proliferation
The safeguards and non-proliferation SCA covers the programs and activities required for the successful implementation of the obligations arising from the Canada/IAEA safeguards agreements, as well as all other measures arising from the Treaty on the Non-Proliferation of Nuclear Weapons (NPT).
CNSC staff assess performance in the safeguards and non-proliferation SCA by verifying licensee compliance through desktop reviews and in-field activities, including participation in IAEA verification activities. CNSC staff verify that licensees meet Canada’s international safeguards obligations as well as other measures arising from the NPT. CNSC staff ensure that the licensees have implemented and maintained effective programs to allow the implementation of both safeguards measures and non-proliferation commitments.
NNCs from inspections and safeguards verification activities related to the safeguards and non-proliferation SCA were issued for the following licensees over the reporting period:
- 1 NNC at BWXT-NEC (Toronto & Peterborough) related to not using the Canadian obligation code on the inventory change document
- 2 NNCs at BRR related to its accountability scale where Cameco was requested to assess its calibration and maintenance practices, including the use of standard weights for calibration, and implement clear position markings for the placement of tote bins
- 1 NNC at PHCF requesting that actions be taken to ensure that calibration requirements are consistently being met at the UF4 drumming station
The licensees have taken the necessary actions to address the above noted NNCs. The findings did not affect the health and safety of workers, the public, or the environment, or the safe operation of the facility. CNSC staff continue to monitor the facilities compliance to the REGDOC-2.13.1, Safeguards and Nuclear Material Accountancy [11], including the implementation of scale calibration procedures.
The licensees require a licence, separate from the licensing of their operations, for the import and export of controlled nuclear substances, equipment and information identified in the Nuclear Non-proliferation Import and Export Control Regulations [12].
CNSC staff concluded that the UNSPFFootnote 2 and RRs met regulatory requirements and maintained and implemented satisfactory safeguards and non-proliferation programs for the applicable reportable years. CNSC staff will continue to monitor performance through regulatory oversight activities pertaining to this SCA.
6.14 Packaging and transport
The packaging and transport SCA covers the safe packaging and transport of nuclear substances to and from the licensed facilities. CNSC staff assess performance in the packaging and transport SCA by verifying compliance of licensee documents and programs through desktop reviews and through compliance verification inspections that are planned or reactive. CNSC staff ensure that all elements of package design, package maintenance, and the registration for use of certified packages are in compliance with the Packaging and Transport of Nuclear Substances Regulations, 2015 [13] and Transportation of Dangerous Goods Regulations [14].
There were no NNCs from inspections related to the packaging and transport SCA for the licensees covered in this report, over the reporting periods. CNSC staff concluded that the UNSPF and RRs met regulatory requirements and maintained satisfactory ratings in the packaging and transport SCA for the applicable reportable years. CNSC staff will continue to monitor performance through regulatory oversight activities pertaining to this SCA.
7 The CNSC’s assessment of safety at uranium and nuclear substance processing facilities and research reactors
7.1 Reportable events
Detailed requirements for reporting unplanned situations or events at UNSPF and RRs to the CNSC are included in the applicable LCH. CNSC REGDOC-3.1.2, Reporting Requirements for Non-Power Reactor Class I Nuclear Facilities and Uranium Mines and Mills [5] came into force for UNSPF and RRs in January 2019. Over the period covered by this report, licensees complied with the requirements for submission of these reports.
CNSC staff are satisfied with licensees’ responses to reportable events. Licensees conducted investigations and/or implemented corrective actions for all of these low-risk reportable events, to the satisfaction of CNSC staff. As a result, CNSC staff concluded that all uranium and nuclear substance processing facilities and research reactors managed operations safely and that there were no impacts to workers, the public and the environment.
Appendix L provides a list of the reportable events that occurred over the review period.
7.1.1 Uranium and nuclear substance processing facilities
There were 24 events reported for the UNSPF in 2020.
BRR
- On April 24, 2020, Cameco reported a fire in the yard area involving totes containing contaminated combustible materials (CCM) in storage awaiting incineration. This event promoted the activation of the emergency response team which effectively worked along with the Blind River Fire Department and Mississauga First Nations Fire Department to extinguish the fire. Investigations were completed and confirmed there were no adverse impacts to the environment or to the health and safety of people as a result of this event. Cameco has since implemented several corrective actions to prevent or mitigate a recurrence of this event. CNSC staff are satisfied with Cameco’s responses including corrective actions taken.
- Cameco reported a total of 2 transportation-related events. On February 17, 2020, the BRR received a shipment of CCM that had a couple of bags that were partially open. On November 3, 2020, a transport vehicle hit a moose while returning to BRR. The trailer was transporting empty UO3 tote bins when the accident occurred. There was no damage to the trailer or bins and no injuries. Traffic accidents are to be reported to the CNSC even when packages are not directly affected. The required event reports for these events were submitted in accordance with the regulatory requirements. They have been reviewed by CNSC staff and found satisfactory.
PHCF
- Cameco reported a total of 3 releases to Port Hope Harbour in 2020. On March 3, 2020, precipitation accumulation was mechanically pumped from a construction area to the harbour enclosure without suspended solids removal per Ontario Ministry of the Environment, Conservation and Parks (MECP) environmental control requirements. Cameco suspended this activity as soon as the issue was identified. On August 27, and October 12, algae buildup on surface water intake screens caused cooling water pumps to shut down, which resulted in municipal water discharge to the harbour without the normal dilution from surface water. In all 3 cases, investigations were completed, and corrective actions were implemented to proactively avoid further issues.
- On July 22, 2020, a fluorine leak at a purge line gasket resulted in a UF6 stack peak of 1600 g/h fluorides. The plant responded appropriately with all safety systems performing as designed. Ambient air monitoring stations (lime candle) results were reviewed and found to be within baseline conditions. There were no impacts to the environment or to the health and safety of people attributed to this event.
- On November 8, 2020, the Emergency Response Team was activated as a precaution as a result of a small hydrogen fluoride leak on the UF6 plant electrolyte makeup tank regulator. The leak was isolated and there were no injuries or exposures as a result of this event. Corrective actions and follow-up were documented by Cameco. There were no impacts to the environment or to the health and safety of people attributed to this event.
- On December 11, 2020, a UF6 operator suffered an injury to the right thumb when it was pinched between a flange and the hood of the drum dryer. The employee was attended to by the site nurse and was subsequently taken to the hospital for follow-up care. The investigation was documented by Cameco and follow up corrective actions were implemented.
- Cameco reported a total of 2 transportation related events in 2020. On June 29, Cameco was notified that a truck transporting a full cylinder was involved in a vehicle accident at the Port of Montreal. The material originated from the PHCF; however, the shipment was in the control of Orano at the time. On November 3, Cameco was notified of sea containers that had shifted during transit between the PHCF and Europe. This resulted in damaged flat racks, but the load was not compromised as a result of the incident. There were no injuries and no releases of nuclear material for both events.
CFM
- In 2020, there was 1 reportable event when an exterior liquid hydrogen tank began venting excessively. An investigation into the event identified that pressure had built up in the tank due to low hydrogen usage, and confirmed that all safety systems functioned as intended. The primary corrective action taken was to manage the tank level more closely in preparation, and during, low usage periods, such as future planned maintenance shutdowns.
There were no impacts to the environment, the health and safety of workers or the public. CNSC staff are satisfied with Cameco’s response to this event and consider this event closed.
BWXT
- In January 2020, BWXT-NEC reported a sprinkler impairment at the Peterborough facility that lasted until May 2020. BWXT-NEC submitted a 21-day report with corrective actions as required, as well as a coordination plan with GE Canada Inc., as the owner of the site, implementing the corrective actions involving common infrastructure. BWXT-NEC implemented several interim fire safety measures during this sprinkler impairment, including posting of notices on all affected building entryways, suspension of hot work in areas where sprinklers were impaired, establishment of fire watch, notification to the Peterborough fire department and regulatory updates to the CNSC on progress in dealing with the sprinkler impairment. There were no impacts to the environment, the health and safety of workers or the public. CNSC staff are satisfied with BWXT-NEC’s response to this event and consider this event closed.
Nordion
- On March 11, 2020, the fire alarm sounded in Nordion’s Kanata Operations Building, initiating an evacuation. It was determined to be a false alarm due to a high heat sensor reading. The fire department arrived at the Nordion site and left once it was determined to be a false alarm. It was determined that the heat sensor was operating normally. Corrective actions were being assessed to ensure that heat build-up remained below sensor activation.
- On April 6, 2020, there was a false low flow alarm from the fire protection system that lead to evacuation of the Kanata Operations Building and the fire department arriving onsite. It was determined that the alarm was caused by a false low flow detector alarm in the sprinkler system. A new sensor was installed, as this was the most probable point of failure and cause of the false alarm.
- On April 21, 2020, fire alarm panel wires were damaged during construction work by a contractor, resulting in the fire alarm system being temporarily disabled. Corrective actions were taken by the contractor, and Nordion initiated a corrective and preventative action to implement broader corrective actions.
- Nordion reported 5 transportation-related events. On September 22 and December 2, 2020, a Type A packageFootnote 3 was reported missing in transit; however, the packages were located by the carrier in each case. On September 17, 2020, a Type A package was reported missing in transit and not found; however, radioactivity decayed below exemption quantities. On May 12, 2020, a Type A package was damaged during transit and was to be repaired or removed from the fleet. No implications resulted as these events were of low risk. On February 25, 2020, an incoming Type B package was received with a loose lid on the leak proof insert. Feedback was provided to the consignor to ensure packages are prepared appropriately.
- On April 20, 2020, a shipment of cobalt-60 sealed sources was exported from Canada. The shipment inadvertently contained 1 incorrect source. This resulted in the shipment marginally exceeding the allowed activity for the CNSC export licence, EL-SS-12823-US. This also caused the wrong sealed source tracking information to be submitted resulting in a non-compliance with the Packaging and Transport of Nuclear Substances Regulations, 2015, licence conditions of EL-SS-12823-US and section 4.2 of Nordion’s LCH regarding reporting of sources prior to shipments. Nordion has revised its internal procedures to implement more robust requirements for independent verification of sources during loading operations. The licensee is also investigating improvements to the processes and tools for assessing the reportability of incidents as part of corrective actions related to this occurrence.
- On July 13, 2020, it was determined that Nordion had conducted imports of thoriated welding rods without obtaining CNSC import licences. At the time, the thoriated welding rods were approved as an inventory item, the requirement for a CNSC import licence when ordering from non-Canadian suppliers was not identified and noted on the item master. A review of all inventory items was completed to identify any other items that may require regulatory approvals prior to ordering. No further items found.
BTL
- On May 22, 2020, a pull station was activated outside of the vacuum lab due to smoke that was accumulating within the facility from torching work of the ongoing roof replacement project. The building was evacuated and the fire department responded to the alarm activation. The fire department confirmed the small roof fire was extinguished. The investigation identified that an expansion joint had caught fire. This may have gone unseen due to the conditions created when exhausting smoke from the facility. The incident and lessons learned were discussed with the Emergency Response Committee and the roof contractors.
7.1.2 Research reactors
There were 2 events reported for the RRs over the last 3 years.
MNR
- On July 24, 2020, MNR reported that the reactor had been operated for approximately 8 hours with one of its trip signals impaired on "flapper position". The flapper is a device at the bottom of the reactor pool which automatically triggers alternate core cooling (from forced cooling to convective) in case of a reduction in cooling flow. A position sensor on the flapper trips the reactor when it senses that the flapper has actuated to the low flow position. A pushrod is associated with this sensor to actuate a switch on the reactor bridge and trigger a reactor trip. This pushrod had been damaged during reactor maintenance and did not assure its trip signal function during one shift. Several other trip signals were available and in‐service during the duration of the impairment, which mitigated the risk associated with this event. No condition occurred during the operation of the reactor that would have required actuation of this trip signal. A root cause investigation was completed and submitted to the CNSC, and a corrective action plan was initiated. CNSC staff assessed the event and the corrective action plan and are satisfied that the event has been resolved satisfactorily. There were no consequences associated with this event, and the increased risk associated with the unavailability of a 1trip signal was mitigated by the redundancy of safety systems.
Polytechnique Montréal
- Polytechnique Montréal reported on August 12, 2020, that the reactor operator had operated the Polytechnique Montréal SLOWPOKE-2 reactor for more than a month after their Reactor Operator Certificate had expired. CNSC staff administered the recertification of the operator shortly after Polytechnique Montréal requested it. CNSC staff also reviewed Polytechnique Montréal’s corrective action plan to ensure that the event would not happen again. The risk associated with this event was low, there were no consequences as a result of this event, and this matter was resolved to the CNSC’s satisfaction.
7.2 Public engagement
Public engagement has 2 aspects: activities carried out directly by CNSC staff, and activities carried out by licensees.
7.2.1 CNSC
The NSCA mandates the CNSC to disseminate objective scientific, technical and regulatory information to the public concerning its activities and the activities it regulates. CNSC staff fulfill this mandate in a variety of ways, including the publishing of RORs and through ‘Meet the Regulator’ sessions. CNSC staff also seek out other opportunities to engage with the public and Indigenous Nations and communities, often participating in meetings or events in communities with interest in nuclear sites. These allow CNSC staff to answer questions about the CNSC’s mandate and role in regulating the nuclear industry.
Due to the ongoing COVID-19 pandemic, CNSC outreach in 2020 was reduced from previous years and limited to virtual events, including hosting and participating in webinars.
The CNSC awarded participant funding to assist Indigenous peoples, members of the public and stakeholders in reviewing this ROR and submitting comments to the Commission. Participant funding recipients are listed in Appendix N.
7.2.1.1 CNSC activities – BWXT-NEC Peterborough
In December 2020, the Commission renewed BWXT-NEC’s operating licence for Peterborough and Toronto. In its record of decision [15], the Commission directed CNSC staff to conduct an information session in Peterborough, Ontario, to explain the beryllium resampling results to the community and to answer any questions that the community may have had. CNSC staff provided a memo to the Commission in February 2021 that addressed the Commission’s direction where CNSC staff committed to reporting on these outreach activities.
CNSC staff completed several public outreach activities associated with BWXT-NEC’s licence renewal and beryllium resampling including the following:
- CNSC staff, with MECP support, presented on March 11, 2021 to the BWXT-NEC Peterborough Community Liaison Committee, which has a diverse membership including neighbours, representatives from the Prince of Wales Public School and Peterborough Public Health, the Metis Nation of Ontario and Dr. Julian Aherne. CNSC staff’s presentation was well received and all questions raised were answered.
- On March 31, 2021, 2 public webinars were held. CNSC staff provided a presentation on the licence renewal, beryllium sampling and answered questions from participants. A total of 128 people participated. The most popular means by which participants found out about the webinar was through a mail drop. There was a noticeable increase in the level of understanding of the participants about the CNSC and beryllium based on before-and-after polling questions.
- In April 2021, CNSC staff had an initial meeting with Dr. Aherne to discuss outstanding issues on beryllium sampling, and an Independent Environmental Monitoring Program (IEMP) sampling plan was developed. Additional meetings were being planned to follow up on issues discussed at the time of writing this report.
- In May 2021, CNSC staff also presented to the Peterborough Board of Health on the role of the CNSC, the licence renewal, and the results of the beryllium resampling. The board is made up of local elected representatives as well as Indigenous representatives. Peterborough Public Health members, including the Medical Officer of Peterborough, were also present.
- IEMP sampling at Peterborough was completed in June 2021. Key stakeholders in the Peterborough area were notified of the planned IEMP sampling campaign in June.
Several actions from this outreach were rolled into regular compliance activities to ensure ongoing engagement. These included, formalizing continuous discussions with Curve Lake First Nation (CLFN) on BWXT-NEC related matters (see section 7.3.1.1 of this report); holding follow-up meetings with Dr. Aherne on environmental sampling; updating the CNSC web page for BWXT-NEC as needed; and continuing to reply in a timely fashion to questions and concerns from members of the public and Indigenous Nations and communities related to BWXT-NEC.
In conclusion, CNSC staff have successfully carried out the planned activities that were outlined in their Peterborough public engagement plan in a timely fashion. Outreach activities were well received and deemed effective based on polling feedback. CNSC staff are committed to continuing to share information of interest that relates to BWXT-NEC and to continue to engage with the public, Indigenous Nations and communities and other interested parties.
7.2.2 Uranium and nuclear substance processing facilities
All uranium and nuclear processing facility licensees are required to maintain and implement public information and disclosure programs (PIDPs), in accordance with REGDOC-3.2.1, Public Information and Disclosure [16]. These programs are supported by disclosure protocols that outline the type of facility information to be shared with the public as well as details on how that information is to be shared. This ensures that timely information about the health, safety and security of persons and the environment, and other issues associated with the lifecycle of nuclear facilities, is effectively communicated to the public.
All licensees of UNSPF have approved PIDPs. NNCs from inspections related to PIDPs were issued for the following licensee over the reporting period:
- At BWXT-NEC (Toronto and Peterborough), 1 NNC related to Community Liaison Committee membership being representative of target audience, and 1 NNC related to media strategy and communication products
The licensee has taken all necessary corrective actions to address the NNCs.
In 2020, licensees faced many challenges due to the COVID-19 pandemic, and had to adapt their public information programs accordingly. This included moving away from traditional in-person meetings and events, and offering webinars and increased digital communications whenever possible.
This included:
- providing web updates on the pandemic and other items of interest
- providing updates to the local public and stakeholders through regular newsletters (both virtual and direct mail)
- engaging with local/national media to provide operational and facility updates
- in lieu of in-person events and sponsorship, creating new community support funds, which could be accessed by important local efforts and organizations
7.2.3 Research reactors
As with uranium and nuclear processing facility licensees, all RR licensees are required to maintain and implement PIDPs.
Upon review of these sites for the years 2018–20, CNSC staff determined that all 4 RR licensees continued to have approved PIDPs. RR licensees SRC, MNR, Polytechnique Montréal and RMC were deemed in compliance for the years 2018–20 based on CNSC staff’s reviews of their annual compliance reports and supplied supplemental information.
It was identified that some of the licensees’ PIDPs required revisions in order to meet REGDOC-3.2.1 requirements, but they were deemed sufficient in the meantime.
CNSC staff will work to ensure that all RR licensees have updated their PIPDs in accordance with REGDOC-3.2.1, and that these requirements are included in their respective LCHs.
7.3 Indigenous consultation and engagement
As an agent of the Government of Canada and as Canada's nuclear regulator, the CNSC recognizes and understands the importance of consulting and building relationships with Indigenous peoples in Canada. CNSC staff are committed to building long-term relationships with Indigenous Nations and communities (see Appendix M) who have interest in CNSC-regulated facilities within their traditional and/or treaty territories. By pursuing informative and collaborative ongoing interactions, the CNSC aims to build relationships and trust. The CNSC’s Indigenous consultation and engagement practices – which include information sharing and funding support through its Participant Funding Program – to assist Indigenous peoples in meaningfully participating in Commission proceedings and ongoing regulatory activities are consistent with the principles of upholding the honour of the Crown and reconciliation.
7.3.1 CNSC Staff Engagement Activities
The UNSPF in Canada fall within the traditional and/or treaty territories of many Indigenous communities (see appendix M). CNSC staff efforts in 2020 supported the CNSC’s ongoing commitment to meet its consultation obligations and build relationships with Indigenous peoples with interests in Canada’s uranium and nuclear processing facilities. CNSC staff continued to work with Indigenous communities and organizations to identify opportunities for formalized and regular engagement, including meetings and workshops, throughout the lifecycle of these facilities. Through this engagement, CNSC staff welcomed the opportunity to discuss and address topics of interest and concern related to CNSC-regulated activities to interested Indigenous communities.
In addition, to ensure that interested Indigenous communities were made aware of this 2020 ROR, CNSC staff provided them with a notice of the Participant Funding Program opportunity to review and comment on it, as well as the opportunity to submit a written intervention and/or appear before the Commission as part of the Commission meeting. CNSC staff also sent copies of this report to all Indigenous communities and organizations who had requested that they be kept informed of activities at the facilities covered in the report.
7.3.1.1 BWXT-NEC Peterborough
In December 2020, the Commission renewed BWXT-NEC’s operating licence for Peterborough and Toronto. In its record of decision [15], the Commission provided direction to CNSC staff and BWXT-NEC on Indigenous engagement. CNSC staff committed to reporting on this Indigenous engagement in this report.
Following the renewal, CNSC staff provided the record of decision to all Indigenous Nations and communities that participated as intervenors during the Commission hearing. In addition, in February 2021, the CNSC and CLFN signed terms of reference to provide a forum through which to collaborate and address areas of interest or concern regarding CNSC-regulated facilities and activities, such as BWXT-NEC. Since February 2021, CNSC staff have held monthly meetings with CLFN and provided updates on BWXT-NEC’s activities.
Formal emails were also sent on February 26, 2021, to inform interested Indigenous Nations and communities of the 2021 IEMP sampling campaigns planned near the BWXT-NEC site in Peterborough, and their input on the IEMP sampling plan. As CLFN had previously demonstrated interest in participating during the sampling activities, meetings were organized to discuss the IEMP and the sampling plan on February 8 and May 7, 2021. A webinar on the IEMP was also held on April 28, 2021 for all CLFN community members interested in learning more about the program and the CNSC’s collaboration with CLFN. CLFN also invited community members to participate in sampling activities through their newsletter. IEMP sampling activities were conducted in June 2021 with the participation of CLFN observers. CNSC staff will also share IEMP results with all interested Indigenous Nations and communities once they are made available.
CLFN has emphasized the importance for CNSC and BWXT-NEC to continue sharing information and allowing CLFN to participate in CNSC’s processes, including the CNSC’s IEMP. CNSC staff are committed to continue sharing information of interest that relates to BWXT-NEC and to respond to any concerns Indigenous Nations and communities may have.
7.3.1.2 Research Reactors
RRs are low-risk facilities, and the CNSC has not been made aware of any specific interest or concerns from Indigenous Nations and communities in relation to these licensed facilities and activities. However, CNSC staff are committed to providing any information and engaging Indigenous Nations and communities with regards to these facilities should interest be expressed.
7.3.2 Licensee Engagement Activities
In 2020, CNSC staff continued to monitor the engagement work conducted by the UNSPF licensees to ensure that they actively engage and communicate with Indigenous Nations and communities who have interest in their facilities.
CNSC staff confirm that the licensees have Indigenous engagement and outreach programs. Throughout 2020, the UNSPF licensees met and shared information with interested Indigenous communities and organizations. These efforts have included emails, letters, meetings, site visits and tours, as well as community visits, upon request. The CNSC encourages the UNSPF licensees to continue to develop relationships and engage with Indigenous Nations and communities who have expressed an interest in the licensee’s activities.
7.4 CNSC Independent Environmental Monitoring Program
Where applicable, the licensee of each nuclear facility shall develop, implement and maintain an environmental monitoring program to demonstrate that the public and the environment are protected from emissions resulting from the licensee’s licensed activities. The licensees submit the results of these monitoring programs to the CNSC to ensure compliance with applicable requirements, as set out in the applicable regulations.
The CNSC implements its IEMP to independently verify that the public and the environment around licensed nuclear facilities are protected. The IEMP is separate from, but complementary to the CNSC’s ongoing compliance verification program. Under the IEMP, samples are taken from public areas around licensed facilities. The concentrations of radioactive and hazardous substances in those samples are measured and analyzed, and the results are compared against relevant guidelines, limits and objectives.
In 2020, CNSC staff conducted independent environmental monitoring at Cameco’s BRR, PHCF, and CFM sites. The 2020 IEMP results, which are posted on the CNSC's IEMP web page, demonstrate that the public, Indigenous Nations and communities and the environment around these facilities are protected, and that no adverse environmental or health effects are expected as a result of these facility operations. In addition, these results are consistent with the results submitted by the licensees and demonstrate that the licensees’ environmental protection programs continue to protect the health and safety of people and the environment.
7.4.1 BWXT-NEC Peterborough Sampling
Further to the BWXT-NEC licence renewal hearing in March 2020, the CNSC conducted soil resampling for beryllium, as directed by the Commission in its notice of continuation, at sites adjacent to BWXT-NEC’s Peterborough facility, with a special focus on the property where the Prince of Wales Elementary School is located. The soil samples were analyzed at the CNSC lab, and the results did not indicate any significant changes in concentrations of beryllium in the soil in Peterborough. The CNSC provided a supplemental submission (CMD 20-H2.D) on the resampling results for the Commission’s consideration in BWXT-NEC’s licence renewal request. Based on CNSC staff’s assessment, the IEMP results indicate that the public and the environment surrounding the BWXT-NEC facility remains protected from facility emissions.
In the BWXT-NEC record of decision [15], the Commission directed CNSC staff to carry out an IEMP campaign near the Peterborough facility in 2021. In addition, CNSC staff are analyzing all future IEMP soil samples using the partial digestion analysis opposed to the full digestion analysis method. This decision was made since partial digestion of soil better reflects the bioavailability of elements and allows a direct comparison to soil standards and guidelines which are based on partial digestion.
Recognizing the importance of trust building and communication with host communities, the Commission directed CNSC staff to engage Indigenous communities, members of the public, stakeholders, and municipal officials, in future Peterborough IEMP sampling campaigns. Efforts to date are summarized in sections 7.2.1.1 and 7.3.1.1 of this report.
7.5 COVID-19 Response
7.5.1 CNSC
On March 15, 2020, the CNSC activated its business continuity plan in response to the COVID-19 pandemic. Effective March 16, 2020, all CNSC staff in Ottawa and at regional and site offices were directed to work from home. Travel to sites for inspection was suspended until approved COVID-19 protocols were in place. Onsite inspection activities planned for 2020 were reviewed and reprioritized.
In April 2020, CNSC staff reviewed all planned onsite compliance activities on a risk-informed basis to determine an appropriate path forward. CNSC staff identified planned compliance activities well suited to be delivered by other means (remote verification methods, desktop review of documents and licensee submissions, etc.) and adjusted planned activities accordingly. Licensee changes drove many changes to CNSC oversight.
The CNSC developed a pandemic-related pre-job brief as additional instructions to be delivered by CNSC directors and supervisors to inspectors prior to performing any onsite oversight activities. The CNSC provided personal protective equipment to inspectors prior to any onsite activity. The pre-job brief clearly outlines the rights of individual employees to not attend an in-person inspection if they feel it is unsafe to do so.
Compliance activities for nuclear fuel cycle facilities continued remotely and onsite oversight activities have since resumed on a risk-informed basis in observance of relevant COVID-19 health protocols. In 2020, some inspections were rescheduled or postponed for certain SCAs where onsite presence was necessary; however, the majority of inspections continued remotely or were conducted using a hybrid virtual/in-person approach, in order to minimize in-person time onsite.
CNSC staff continue to conduct oversight activities during the COVID-19 pandemic to ensure the protection of the environment, and the health and safety of people. Specific oversight activities completed in 2020 during the pandemic are outlined in Appendix B of this report.
7.5.2 UNSPF and Research Reactors
In response to the COVID-19 pandemic, UNSPF and RRs implemented various measures to reduce operations, activate business continuity plans, and have non-essential staff work remotely, where possible. Licensees instituted measures to minimize the spread of COVID-19 by making workers wear face masks and limiting the size of groups of employees in any areas.
The state of reduced operations included only work to ensure sites, facilities, equipment, and grounds were maintained and kept safe and compliant with regulatory requirements. For facility activities that were not put on hold, the licensee worked to follow all public health guidelines and additional safety protocols. All facilities maintained appropriate security measures throughout this period.
Each facility continues to evaluate new information and risk related to COVID-19 at their sites and local communities. CNSC staff are informed as changes are made by licensees to adhere to any new guidelines made available by the provincial health authorities.
8 Overall conclusions
CNSC staff concluded that UNSPF in 2020 and the RRs in Canada from 2018–2020 operated safely. This assessment is based on CNSC staff’s verification of licensee activities, including inspections, reviews of reports submitted by licensees, and reviews of events supported by follow-up and general communication with the licensees.
The performance ratings in all 14 SCAs for the facilities were rated as "satisfactory".
CNSC staff’s compliance verification activities confirmed that:
- radiation protection programs at all facilities were effective and adequately controlled radiation exposures, keeping doses ALARA
- environmental protection programs at all facilities were effective in protecting people and the environment
- conventional health and safety programs at all facilities continued to protect workers
CNSC staff concluded that the licensees discussed in this report made adequate provision for the health and safety of workers, as well as for the protection of the public and the environment, and for meeting Canada’s international obligations on the peaceful use of nuclear energy.
CNSC staff will continue to provide regulatory compliance oversight to all licensed facilities.
References
- Nuclear Safety and Control Act, S.C. 1997, c. 9.
- CNSC, Minutes of the Canadian Nuclear Safety Commission (CNSC) Meeting held on December 8, 9 and 10, 2020, Ottawa, Canada, April 2021.
- CSA Group, CSA N286-12 Management Systems for Nuclear Facilities, 2012.
- CNSC, REGDOC-2.2.2, Personnel Training, Ottawa, Canada, 2016.
- CNSC, REGDOC-3.1.2: Reporting Requirements for Non-Power Reactor Class I Nuclear Facilities and Uranium Mines and Mills, Ottawa, Canada, 2018.
- CSA Group, CSA N288.6-12, Environmental Risk Assessments at Class I Nuclear Facilities and Uranium Mines and Mills, 2012.
- CNSC, Memo, CNSC Staff Position Regarding the Environmental Protection Requirements for SLOWPOKE-2 Facilities, 2013, e-Doc 4059738.
- Radiation Protection Regulations, SOR/2000-203.
- General Nuclear Safety and Control Regulations, SOR/2000-202.
- Canada Labour Code, R.S.C., 1985, c. L-2.
- CNSC, REGDOC-2.13.1: Safeguards and Nuclear Material Accountancy, Ottawa, Canada, 2018.
- Nuclear Non-proliferation Import and Export Control Regulations, SOR/2000-210.
- Packaging and Transport of Nuclear Substances Regulations, SOR/2015-145.
- Transportation of Dangerous Goods Regulations, SOR/2001-286.
- CNSC, Record of Decision, Application for the Renewal of the Fuel Facility Licence for BWXT’s Toronto and Peterborough Facilities (DEC 20-H2), 2020.
- CNSC, REGDOC-3.2.1, Public Information and Disclosure, Ottawa, Canada, 2018.
- CNSC, REGDOC‑3.6, Glossary of CNSC Terminology, Ottawa, Canada, 2019.
- CSA Group, CSA N288.1-14, Guidelines for Calculating Derived Release Limits for Radioactive Materials in Airborne and Liquid Effluents for Normal Operation of Nuclear Facilities, 2019.
- Ministry of the Environment, Conservation and Parks, Ontario’s Ambient Air Quality Criteria, 2019.
- Health Canada, Guidelines for Canadian Drinking Water Quality, 2017.
- CSA Group, CSA N288.7 Groundwater Protection Programs at Class I nuclear facilities and Uranium Mines and Mills, 2015.
- Canadian Council of Ministers of the Environment, Canadian Water Quality Guidelines for the Protection of Aquatic Life, 1999.
- Canadian Council of Ministers of the Environment, Canadian Soil Quality Guidelines for the Protection of Environmental and Human Health, 1999.
- Ministry of the Environment, Soil, Groundwater, and Sediment Standards for Use Under Part XV.1 of the Environmental Protection Act, Table 3: Full Depth Generic Site Condition Standards in a Non-Portable Groundwater Condition for Industrial/Commercial/Community Property Use (Fine to Medium Textured Soils), 2011.
- Province of Ontario. Water Management: Policies, Guidelines, Provincial Water Quality Objectives – Table of PWQOs and Interim PWQOs.
- CNSC, REGDOC-1.6.1, Regulatory Quantities for Typical Radionuclides, Sewer – Appendix R, Ottawa, Canada, 2017.
Acronyms and Abbreviations
- ALARA
- as low as reasonably achievable, taking into account social and economic factors
- BE
- below expectations
- Bq
- becquerel
- BRR
- Blind River Refinery
- BTL
- Best Theratronics Ltd.
- BWXT
- BWX Technologies Ltd.
- BWXT-MED
- BWXT Medical Ltd.
- BWXT-NEC
- BWXT Nuclear Energy Canada Inc.
- CAD
- Canadian dollar
- Cameco
- Cameco Corporation
- CANDU
- Canada Deuterium Uranium
- CCM
- contaminated combustible materials
- CCME
- Canadian Council of Ministers of the Environment
- CFM
- Cameco Fuel Manufacturing Inc.
- CLFN
- Curve Lake First Nation
- CMD
- Commission member document
- CNL
- Canadian Nuclear Laboratories
- CNSC
- Canadian Nuclear Safety Commission
- CSA
- Canadian Standards Association (now CSA Group)
- CVC
- compliance verification criteria
- DDP
- detailed decommissioning plan
- DRL
- derived release limit
- EBRL
- Exposure-based release limit
- EMS
- environmental management system
- ERA
- environmental risk assessment
- ESDC
- Employment and Social Development Canada
- FFL
- fuel facility licence
- FFOL
- fuel facility operating licence
- FS
- fully satisfactory
- g
- gram
- GBq
- gigabecquerel
- GCDWQ
- Guidelines for Canadian Drinking Water Quality
- GTLS
- gaseous tritium light source
- h
- hour
- HEU
- Highly enriched uranium
- HT
- tritium gas
- HTO
- hydrogenated tritium oxide or tritiated water
- HNO3
- nitric acid
- I-125
- iodine-125
- IAEA
- International Atomic Energy Agency
- IEMP
- Independent Environmental Monitoring Program
- kg
- kilogram
- km
- kilometre
- L
- litre
- LCH
- licence conditions handbook
- LEU
- low enriched uranium
- LTI
- lost-time injury
- m3
- cubic metres
- MBq
- megabecquerel
- MeV
- megaelectronvolt
- mg
- milligram
- mg/L
- milligram per litre
- MECP
- Ontario Ministry of the Environment, Conservation and Parks
- MNR
- McMaster Nuclear Reactor
- mSv
- millisievert
- N
- nitrogen
- NEW
- nuclear energy worker
- NNC
- notice of non-compliance
- NOx
- nitrogen oxides
- NO2
- nitrogen dioxide
- Nordion
- Nordion (Canada) Inc.
- NPROL
- Non-power research reactor operating licence
- NPT
- Treaty on the Non-Proliferation of Nuclear Weapons
- NSCA
- Nuclear Safety and Control Act
- NSPFOL
- nuclear substance processing facility operating licence
- PHCF
- Port Hope Conversion Facility
- PIPD
- public information and disclosure programs
- ppm
- parts per million
- RMC
- Royal Military College of Canada
- RR
- Research reactor
- ROR
- regulatory oversight report
- SA
- satisfactory
- SAT
- systematic approach to training
- SCA
- safety and control area
- SRBT
- SRB Technologies (Canada) Inc.
- SRC
- Saskatchewan Research Council SLOWPOKE-2
- T2
- tritiated gas
- TBq
- terabecquerel
- μg
- microgram
- μSv
- microsievert
- UF6
- uranium hexafluoride
- UNSPF
- uranium and nuclear substance processing facilities
- UO2
- uranium dioxide
- UO3
- uranium trioxide
- U.S. DOE
- United States Department of Energy
- VIM
- Vision in Motion
Glossary
For definitions of terms used in this document, see REGDOC-3.6, Glossary of CNSC Terminology [17], which includes terms and definitions used in the Nuclear Safety and Control Act [1] and the Regulations made under it, and in CNSC regulatory documents and other publications. REGDOC-3.6 is provided for reference and information.
A. Links to Licensee Websites and Annual Compliance Reports
| Licensee | Website | Annual compliance reports |
|---|---|---|
| BRR | camecofuel.com/business/blind-river-refinery | 2020 annual compliance report |
| PHCF | camecofuel.com/business/port-hope-conversion-facility | 2020 annual compliance report |
| CFM | camecofuel.com/business/cameco-fuel-manufacturing | 2020 annual compliance report |
| BWXT-NEC Toronto and Peterborough | nec.bwxt.com | 2020 annual compliance report |
| SRBT | srbt.com | 2020 annual compliance report |
| Nordion | nordion.com | 2020 annual compliance report |
| BTL | theratronics.ca | 2020 annual compliance report |
| MNR | nuclear.mcmaster.ca/facility/nuclear-reactor/ | |
| Polytechnique Montréal | polymtl.ca/phys/slowpoke | |
| RMC | rmc-cmr.ca/en/chemistry-and-chemical-engineering/slowpoke-2-facility | |
| SRCFootnote 4 | src.sk.ca/services/slowpoke-2 |
B. CNSC Inspections
| Inspection title | Safety and control areas covered | Inspection date | Number of NNCs |
|---|---|---|---|
| CAMECO-BRR-2020-01 | Fitness for service Emergency management and fire protection Radiation protection Conventional health and safety Waste management | September 14–16, 2020 | 1 |
| CAMECO-BRR-2020-02 | Environmental protection | September 14–16, 2020 | 0 |
| CAMECO-BRR-2020-03 | Human performance management (training) | October 19–21, 2020 | 1 |
| Inspection Title | Safety and control areas covered | Inspection date | Number of NNCs |
|---|---|---|---|
| CAMECO-PHCF-2020-01 | Pressure boundary and operating performance | July 13–16, 2020 | 2 |
| CAMECO-PHCF-2020-02 | Safety analysis Fitness for service Radiation protection Environmental protection, Conventional health and safety Emergency management and fire protection Waste management Other: Vision in Motion project | August 10–13, 2020 | 3 |
| CAMECO-PHCF-2020-03 | Security | October 26, 2020 | 2 |
| Inspection title | Safety and control areas covered | Inspection date | Number of NNCs |
|---|---|---|---|
| CAMECO-CFM-2020-01 | Radiation protection (primary focus) Conventional health and safety | February 26–27, 2020 | 5 |
| CAMECO-CFM-2020-02 | Security | October 27, 2020 | 2 |
| CAMECO-CFM-2020-03 | Fitness for Service (primary focus) Radiation protection Waste management Conventional health and Safety | October 26–29, 2020 | 2 |
| Inspection title | Safety and control areas covered | Inspection date | Number of NNCs |
|---|---|---|---|
| BWXT-2020-01 | Security | February 20–21, 2020 | 1 |
| BWXT-2020-02 | Public information and disclosure program | August 15–16, 2020 | 2 |
| BWXT-2020-03 | Emergency management and fire protection | September 30–October 1, 2020 | 0 |
| NPECD-BWXT-2020-11 | Nuclear non-proliferation import and export control | November 25–26, 2020 | 1 |
| Inspection title | Safety and control areas covered | Inspection date | Number of NNCs |
|---|---|---|---|
| SRBT-2020-01 | Human performance management | January 27–28, 2020 | 3 |
| SRBT-2020-02 | Radiation protection | October 27–28, 2020 | 0 |
| Inspection title | Safety and control areas covered | Inspection date | Number of NNCs |
|---|---|---|---|
| NORDION-2020-01 | Management systems | September 29–October 1, 2020 | 0 |
| NORDION-2020-02 | Operating performance Fitness for service Radiation protection Environmental protection Conventional health and safety Waste management | November 16–19, 2020 | 3 |
| Inspection title | Safety and control areas covered | Inspection date | Number of NNCs |
|---|---|---|---|
| BTL-2020-02 | Management system | November 2–4, 2020 | 2 |
| BTL-2020-03 | Human performance management | November 2–4, 2020 | 4 |
| Inspection title | Safety and control areas covered | Inspection date | Number of NNCs |
|---|---|---|---|
| 2019-DSN-ÉPM-01 | Security | April 30, 2019 | 3 |
| ÉPM-SLWPK-2020-01 | Conventional health and safety Management system Operating performance Fitness for service Radiation protection Environmental protection Waste management Emergency management and fire protection Public and information disclosure program | February 13, 2020 | 1 |
| Inspection title | Safety and control areas covered | Inspection date | Number of NNCs |
|---|---|---|---|
| MNR-2018-01 | Management system | November 15, 2018 | 2 |
| 2019-NSD-MCMU-01 | Security | October 22, 2019 | 0 |
| MNR-2020-01 | Human performance management – Personnel training | March 9–10, 2020 | 4 |
| Inspection title | Safety and control areas covered | Inspection date | Number of NNCs |
|---|---|---|---|
| RMC-SLWPK-2019-01 | Management system Environmental protection Waste management Fitness for service Radiation protection Security Operating performance Conventional health and safety Human performance management Emergency management & fire protection Public and information disclosure program | February 21, 2019 | 0 |
| 2019-NSD-RMC-01 | Security | October 24, 2019 | 2 |
| Inspection title | Safety and control areas covered | Inspection date | Number of NNCs |
|---|---|---|---|
| SRC-2019-01 | Operating performance Radiation protection Safeguards and non-proliferation security | August 15–16, 2019 | 0 |
| SRC-2020-01 | Decommissioning activities Environmental protection Radiation protection Waste management | July 8–10, 2020 | 1 |
Note: Security inspection reports contain sensitive information and will not be made public.
C. Significant Changes to Licences and Licence Conditions Handbooks
| Licensee | Date | Facility licence | Summary of changes |
|---|---|---|---|
| BWXT-NEC Toronto | December 19, 2020 | FFOL-3620.01/2020 | New renewed licence FFL-3621.00/2030 published |
| BWXT-NEC Peterborough | December 19, 2020 | FFOL-3620.01/2020 | New renewed licence FFL-3620.00/2030 published |
| SRC | December 6, 2019 | NPROL-19.01/2023 | Licence amendment approved to authorize the decommissioning of the SRC SLOWPOKE-2 reactor facilityFootnote 5 |
| Licensee | Date | Facility licence | Summary of changes |
|---|---|---|---|
| BRR | August 11, 2020 | FFOL-3632.00/2020 |
|
| PHCF | July 31, 2020 | FFOL-3631.00/2027 |
|
| CFM | August 20, 2020 | FFOL-3641.00/2022 |
|
| SRBT | February 6, 2020 | NSPFOL-13.00/2022 |
|
| SRC | April 10, 2019 | NPROL-19.01/2023 |
|
| RMC | June 11, 2019 | NPROL-20.00/2023 |
|
D. Regulatory Document Implementation
| Document number | Document title | Version | Status |
|---|---|---|---|
| REGDOC-2.12.3 | Security of Nuclear Substances: Sealed Sources and Category I, II and III Nuclear Material | 2020 | Implemented in 2020 |
| REGDOC-2.13.1 | Safeguards and Nuclear Material Accountancy | 2018 | Implemented in 2020 |
| REGDOC-3.2.1 | Public Information and Disclosure | 2018 | Implemented in 2020 |
| Document number | Document title | Version | Status |
|---|---|---|---|
| REGDOC-2.12.3 | Security of Nuclear Substances: Sealed Sources and Category I, II and III Nuclear Material, Version 2.1 | 2020 | Implemented in 2020 |
| REGDOC-2.13.1 | Safeguards and Nuclear Material Accountancy | 2018 | Implemented in 2020 |
| REGDOC-3.2.1 | Public Information and Disclosure | 2018 | Implemented in 2020 |
| Document number | Document title | Version | Status |
|---|---|---|---|
| REGDOC-2.12.3 | Security of Nuclear Substances: Sealed Sources and Category I, II and III Nuclear Material | 2020 | Implemented in 2020 |
| REGDOC-2.13.1 | Safeguards and Nuclear Material Accountancy | 2018 | Implemented in 2020 |
| REGDOC-3.2.1 | Public Information and Disclosure | 2018 | Implemented in 2020 |
| Document number | Document title | Version | Status |
|---|---|---|---|
| REGDOC-2.8.1 | Conventional Health and Safety | 2019 | Implemented in 2020 |
| REGDOC-2.1.2 | Safety Culture | 2018 | Implemented in 2020 |
| REGDOC-3.2.1 | Public Information and Disclosure | 2018 | Implemented in 2020 |
| Document number | Document title | Version | Status |
|---|---|---|---|
| REGDOC-2.1.2 | Management System: Safety Culture | 2018 | Implemented in 2019 |
| REGDOC-2.13.1 | Safeguards and Nuclear Material Accountancy | 2018 | Implemented in 2019 |
| REGDOC-3.1.2 | Reporting Requirements, Volume I: Non-Power Reactor Class I Nuclear Facilities and Uranium Mines and Mills | 2018 | Implemented in 2019 |
| Document number | document title | Version | Status |
|---|---|---|---|
| REGDOC-3.5.3 | Nuclear Criticality Safety | 2018 | Implemented in 2019 |
| REGDOC-3.2.1 | Public Information and Disclosure | 2018 | Implemented in 2019 |
| CSA N286-12 | Management system requirements for nuclear facilities | 2017 | Implemented in 2019 |
| REGDOC-2.1.2 | Management System: Safety Culture | 2018 | Implemented in 2019 |
| REGDOC-2.2.2 | Personnel Training | 2016 | Implemented in 2019 |
| REGDOC-3.1.2 | Reporting Requirements, Volume I: Non-Power Reactor Class I Nuclear Facilities and Uranium Mines and Mills | 2018 | Implemented in 2019 |
| REGDOC-2.13.1 | Safeguards and Nuclear Material Accountancy | 2018 | Implemented in 2019 |
E. Financial Guarantees
| Facility | Amount (CAD) |
|---|---|
| BRR | $48 million |
| PHCF | $128.6 million |
| CFM | $21 million |
| BWXT-NEC Toronto | $45.6 million |
| BWXT-NEC Peterborough | $6.8 million |
| Facility | Amount (CAD) |
|---|---|
| SRBT | $727,327 |
| Nordion | $45.1 million |
| BTL | $1.8 million |
| Facility | Amount (CAD) |
|---|---|
| Polytechnique Montréal | $1.4 million |
| MNR | $11.7 million |
| RMC | N/AFootnote 6 |
| SRC | $5.8 millionFootnote 7 |
F. Safety and Control Area Ratings
Please note that only the ratings of "satisfactory" (SA) or "below expectations" (BE) were used for the UNSPF (2020) and RRs (2018–20). The "fully satisfactory" (FS) rating was not used, consistent with the approach used for the 2019 RORs. It is important to recognize that if a facility received an SCA rating of FS in previous RORs, and now has a rating of SA, it does not necessarily indicate a reduction in performance. The simplified rating approach considerably reduced the effort that is often needed to reach a consensus on a final rating.
| SCAs | 2016 rating | 2017 rating | 2018 rating | 2019 rating | 2020 rating |
|---|---|---|---|---|---|
| Management system | SA | SA | SA | SA | SA |
| Human performance management | SA | SA | SA | SA | SA |
| Operating performance | SA | SA | SA | SA | SA |
| Safety analysis | SA | SA | SA | SA | SA |
| Physical design | SA | SA | SA | SA | SA |
| Fitness for service | SA | SA | SA | SA | SA |
| Radiation protection | SA | SA | SA | SA | SA |
| Conventional health and safety | FS | FS | FS | SA | SA |
| Environmental protection | SA | SA | SA | SA | SA |
| Emergency management and fire protection | SA | SA | SA | SA | SA |
| Waste management | SA | SA | SA | SA | SA |
| Security | SA | SA | SA | SA | SA |
| Safeguards and non-proliferation | SA | SA | SA | SA | SA |
| Packaging and transport | SA | SA | SA | SA | SA |
| SCAs | 2016 rating | 2017 rating | 2018 rating | 2019 rating | 2020 rating |
|---|---|---|---|---|---|
| Management system | SA | BE | SA | SA | SA |
| Human performance management | SA | SA | SA | SA | SA |
| Operating performance | SA | SA | SA | SA | SA |
| Safety analysis | SA | SA | SA | SA | SA |
| Physical design | SA | SA | SA | SA | SA |
| Fitness for service | SA | SA | SA | SA | SA |
| Radiation protection | SA | SA | SA | SA | SA |
| Conventional health and safety | SA | SA | SA | SA | SA |
| Environmental protection | SA | SA | SA | SA | SA |
| Emergency management and fire protection | SA | SA | SA | SA | SA |
| Waste management | SA | SA | SA | SA | SA |
| Security | SA | SA | SA | SA | SA |
| Safeguards and non-proliferation | SA | SA | SA | SA | SA |
| Packaging and transport | SA | SA | SA | SA | SA |
| SCAs | 2016 rating | 2017 rating | 2018 rating | 2019 rating | 2020 rating |
|---|---|---|---|---|---|
| Management system | SA | SA | SA | SA | SA |
| Human performance management | SA | SA | SA | SA | SA |
| Operating performance | SA | SA | SA | SA | SA |
| Safety analysis | SA | SA | SA | SA | SA |
| Physical design | SA | SA | SA | SA | SA |
| Fitness for service | SA | SA | SA | SA | SA |
| Radiation protection | SA | SA | SA | SA | SA |
| Conventional health and safety | SA | SA | SA | SA | SA |
| Environmental protection | SA | SA | SA | SA | SA |
| Emergency management and fire protection | SA | SA | SA | SA | SA |
| Waste management | SA | SA | SA | SA | SA |
| Security | SA | SA | SA | SA | SA |
| Safeguards and non-proliferation | SA | SA | SA | SA | SA |
| Packaging and transport | SA | SA | SA | SA | SA |
| SCAs | 2016 rating | 2017 rating | 2018 rating | 2019 rating | 2020 rating |
|---|---|---|---|---|---|
| Management system | SA | SA | SA | SA | SA |
| Human performance management | SA | SA | SA | SA | SA |
| Operating performance | SA | SA | SA | SA | SA |
| Safety analysis | SA | SA | SA | SA | SA |
| Physical design | SA | SA | SA | SA | SA |
| Fitness for service | FS | FS | FS | SA | SA |
| Radiation protection | SA | SA | SA | SA | SA |
| Conventional health and safety | FS | SA | FS | SA | SA |
| Environmental protection | SA | SA | SA | SA | SA |
| Emergency management and fire protection | SA | SA | SA | SA | SA |
| Waste management | SA | SA | SA | SA | SA |
| Security | SA | SA | SA | SA | SA |
| Safeguards and non-proliferationFootnote 8 | N/A | N/A | N/A | N/A | N/A |
| Packaging and transport | SA | SA | SA | SA | SA |
| SCAs | 2016 rating | 2017 rating | 2018 rating | 2019 rating | 2020 rating |
|---|---|---|---|---|---|
| Management system | SA | SA | SA | SA | SA |
| Human performance management | SA | SA | SA | SA | SA |
| Operating performance | SA | SA | SA | SA | SA |
| Safety analysis | SA | SA | SA | SA | SA |
| Physical design | SA | SA | SA | SA | SA |
| Fitness for service | SA | SA | SA | SA | SA |
| Radiation protection | SA | SA | SA | SA | SA |
| Conventional health and safety | SA | SA | SA | SA | SA |
| Environmental protection | FS | FS | FS | SA | SA |
| Emergency management and fire protection | SA | SA | SA | SA | SA |
| Waste management | SA | SA | SA | SA | SA |
| Security | FS | FS | FS | SA | SA |
| Safeguards and non-proliferation | SA | SA | SA | SA | SA |
| Packaging and transport | SA | SA | SA | SA | SA |
| SCAs | 2016 rating | 2017 rating | 2018 rating | 2019 rating | 2020 rating |
|---|---|---|---|---|---|
| Management system | SA | SA | SA | SA | SA |
| Human performance management | SA | SA | SA | SA | SA |
| Operating performance | SA | SA | SA | SA | SA |
| Safety analysis | SA | SA | SA | SA | SA |
| Physical design | SA | SA | SA | SA | SA |
| Fitness for service | SA | SA | SA | SA | SA |
| Radiation protection | SA | SA | SA | SA | SA |
| Conventional health and safety | SA | SA | SA | SA | SA |
| Environmental protection | SA | SA | SA | SA | SA |
| Emergency management and fire protection | SA | SA | SA | SA | SA |
| Waste management | SA | SA | SA | SA | SA |
| Security | SA | SA | SA | SA | SA |
| Safeguards and non-proliferation | SA | SA | SA | SA | SA |
| Packaging and transport | SA | SA | SA | SA | SA |
| SCAs | 2016 rating | 2017 rating | 2018 rating | 2019 rating | 2020 rating |
|---|---|---|---|---|---|
| Management system | SA | SA | SA | SA | SA |
| Human performance management | SA | SA | SA | SA | SA |
| Operating performance | SA | SA | SA | SA | SA |
| Safety analysis | SA | SA | SA | SA | SA |
| Physical design | SA | SA | SA | SA | SA |
| Fitness for service | SA | SA | SA | SA | SA |
| Radiation protection | SA | SA | SA | SA | SA |
| Conventional health and safety | SA | SA | SA | SA | SA |
| Environmental protection | SA | SA | SA | SA | SA |
| Emergency management and fire protection | SA | SA | SA | SA | SA |
| Waste management | SA | SA | SA | SA | SA |
| Security | FS | FS | SA | SA | SA |
| Safeguards and non-proliferation | SA | SA | SA | SA | SA |
| Packaging and transport | SA | SA | SA | SA | SA |
| SCAs | 2016 rating | 2017 rating | 2018 rating | 2019 rating | 2020 rating |
|---|---|---|---|---|---|
| Management system | SA | SA | SA | SA | SA |
| Human performance management | SA | SA | SA | SA | SA |
| Operating performance | SA | SA | SA | SA | SA |
| Safety analysis | SA | SA | SA | SA | SA |
| Physical design | SA | SA | SA | SA | SA |
| Fitness for service | SA | SA | SA | SA | SA |
| Radiation protection | SA | SA | SA | SA | SA |
| Conventional health and safety | SA | SA | SA | SA | SA |
| Environmental protection | SA | SA | SA | SA | SA |
| Emergency management and fire protection | SA | SA | SA | SA | SA |
| Waste management | SA | SA | SA | SA | SA |
| Security | SA | SA | SA | SA | SA |
| Safeguards and non-proliferation | SA | SA | SA | SA | SA |
| Packaging and transport | SA | SA | SA | SA | SA |
| SCAs | 2016 rating | 2017 rating | 2018 rating | 2019 rating | 2020 rating |
|---|---|---|---|---|---|
| Management system | SA | SA | SA | SA | SA |
| Human performance management | SA | SA | SA | SA | SA |
| Operating performance | SA | SA | SA | SA | SA |
| Safety analysis | SA | SA | SA | SA | SA |
| Physical design | SA | SA | SA | SA | SA |
| Fitness for service | SA | SA | SA | SA | SA |
| Radiation protection | SA | SA | SA | SA | SA |
| Conventional health and safety | SA | SA | SA | SA | SA |
| Environmental protection | SA | SA | SA | SA | SA |
| Emergency management and fire protection | SA | SA | SA | SA | SA |
| Waste management | SA | SA | SA | SA | SA |
| Security | SA | SA | SA | SA | SA |
| Safeguards and non-proliferation | SA | SA | SA | SA | SA |
| Packaging and transport | SA | SA | SA | SA | SA |
G. Total Annual Releases of Radionuclides Directly to the Environment
The CNSC is making radionuclide release data more readily accessible to the public as part of its commitment to Open Government and its mandate to disseminate this information to the public. This appendix reflects the continued commitment to provide data, within the regulatory oversight reports, on the total annual release of radionuclides.
CNSC staff have commenced publishing annual releases of radionuclides to the environment from nuclear facilities on the CNSC Open Government Portal.
Uranium processing facilities
Direct releases of radionuclides to the environment from uranium fuel refinery, manufacturing and conversion facilities are primarily limited to uranium released to the atmosphere. As uranium is more chemically toxic than radiologically toxic, releases are monitored as total uranium. As a result, the annual load is reported in kilograms. Of these facilities, only Cameco’s Blind River Refinery has direct releases to surface water, with the relevant radionuclides being uranium and radium-226.
| Facility and year | Annual uranium release to air (kg) | Annual uranium released in liquid effluent to surface waters (kg) | Total radium-226 released in liquid effluent to surface waters (MBq) |
|---|---|---|---|
| Blind River Refinery | |||
| 2016 | 1.0 | 1.2 | 0.92 |
| 2017 | 0.8 | 1.9 | 1.04 |
| 2018 | 1.2 | 1.9 | 1.05 |
| 2019 | 2.0 | 2.7 | 2.10 |
| 2020 | 4.8 | 2.8 | 1.40 |
| Port Hope Conversion Facility | |||
| 2016 | 34.3 | N/A | N/A |
| 2017 | 31.5 | N/A | N/A |
| 2018 | 34.1 | N/A | N/A |
| 2019 | 48.5 | N/A | N/A |
| 2020 | 44.4 | N/A | N/A |
| Cameco Fuel Manufacturing | |||
| 2016 | 0.73 | N/A | N/A |
| 2017 | 0.58 | N/A | N/A |
| 2018 | 1.26 | N/A | N/A |
| 2019 | 1.09 | N/A | N/A |
| 2020 | 0.92 | N/A | N/A |
| BWXT Nuclear Energy Canada Inc. Toronto | |||
| 2016 | 0.0108 | N/A | N/A |
| 2017 | 0.0074 | N/A | N/A |
| 2018 | 0.0063 | N/A | N/A |
| 2019 | 0.0071 | N/A | N/A |
| 2020 | 0.0080 | N/A | N/A |
| BWXT Nuclear Energy Canada Inc. Peterborough | |||
| 2016 | 0.000004 | N/A | N/A |
| 2017 | 0.000002 | N/A | N/A |
| 2018 | 0.000002 | N/A | N/A |
| 2019 | 0.000004 | N/A | N/A |
| 2020 | 0.000003 | N/A | N/A |
MBq = megabecquerels; N/A = not applicable
Nuclear substance processing facilities
SRB Technologies (Canada) Inc.
Direct releases to the environment for SRBT are limited to atmospheric releases of tritium. There are no direct releases to surface waters.
| Year | Tritium | |
|---|---|---|
| Tritiated water or HTO (GBq) | Elemental tritium or T2 (GBq) | |
| 2016 | 6.29E+03 | 2.27E+04 |
| 2017 | 7.20E+03 | 1.76E+04 |
| 2018 | 1.07E+04 | 2.24E+04 |
| 2019 | 1.19E+04 | 1.99E+04 |
| 2020 | 9.75E+03 | 1.54E+04 |
GBq = gigabecquerels; HTO = hydrogenated tritium oxide; T2 = tritiated gas
Nordion (Canada) Inc.
Direct radionuclide releases to the environment at Nordion are limited to atmospheric releases.
| Year | Cobalt-60 (GBq) | Iodine-125 (GBq) | Iodine-131 (GBq) | Xenon-133 (GBq) | Xenon-135 (GBq) | Xenon-135m (GBq) |
|---|---|---|---|---|---|---|
| 2016 | 0.006 | 0.21 | 0.35 | 7,277 | 4,299 | 5,421 |
| 2017 | 0.0034 | 0.0012 | 0.0008 | 0 | 0 | 0 |
| 2018 | 0.002 | 0 | 0.006 | 0 | 0 | 0 |
| 2019 | 0.00002 | 0 | 0 | 0 | 0 | 0 |
| 2020 | 0 | 0 | 0 | 0 | 0 | 0 |
GBq = gigabecquerels
Best Theratronics Ltd.
BTL does not have any airborne or liquid radiological releases.
Research Reactors
McMaster Nuclear Reactor
Direct releases to the environment at the McMaster Nuclear Reactor are limited to small residual releases to the atmosphere. There are no direct releases to surface waters.
| Year | Argon-41 (Bq) | Iodine-125 (Bq) | Gross beta/gamma (Bq) |
|---|---|---|---|
| 2016 | 7.1E+11 | 2.5E+08 | 5.0E+05 |
| 2017 | 6.9E+11 | 8.2E+08 | 1.3E+06 |
| 2018 | 7.7E+11 | 4.0E+08 | 1.9E+05 |
| 2019 | 8.4E+11 | 1.3E+08 | 6.4E+05 |
| 2020 | 6.9E+11 | 1.3E+08 | 3.6E+05 |
Bq = gigabecquerels
École Polytechnique de Montréal SLOWPOKE-2
The facility had negligible airborne and no liquid radiological releases.
Royal Military College of Canada SLOWPOKE-2
The facility had negligible airborne and no liquid radiological releases.
Saskatchewan Research Council SLOWPOKE-2
The facility had negligible airborne and no liquid radiological releases.
H. Public Dose Data
This appendix contains information on the estimated dose to the public around UNSPF and RRs. Regulatory release limits known as derived release limits (DRLs) are site-specific calculated releases that could, if exceeded, expose a member of the public of the most highly exposed group to a committed dose equal to the regulatory annual dose limit of 1 mSv/year, pursuant to subsection 1(3) of the Radiation Protection Regulations [8]. DRLs are calculated using CSA standard N288.1-14, Guidelines for Calculating Derived Release Limits for Radioactive Materials in Airborne and Liquid Effluents for Normal Operation of Nuclear Facilities [18].
Considering the fact that the radiological releases from all the sites covered by this ROR have remained small fractions of the DRLs applicable to those sites, the contribution to the dose to the public from these releases remains a very small fraction of the prescribed limit for the general public.
Table H-1 provides a public dose comparison of the UNSPF and RRs. At BRR and Nordion, the dose to public increased in 2020 compared to previous years due to the new DRL values that were applied at these facilities.
| Facility | Year | Regulatory limit | ||||
|---|---|---|---|---|---|---|
| 2016 | 2017 | 2018 | 2019 | 2020 | ||
| BRR | 0.005 | 0.005 | 0.005 | 0.005 | 0.009 | 1 mSv/year |
| PHCF | 0.020 | 0.153Footnote 9 | 0.173 | 0.127 | 0.117 | |
| CFM | 0.023 | 0.022 | 0.030 | 0.027 | 0.020 | |
| BWXT-NEC Toronto | 0.0007 | 0.0175 | 0.0004 | 0.023 | 0.0057 | |
| BWXT-NEC Peterborough | <0.001 | <0.001 | <0.001 | 0.0115 | <0.001 | |
| SRBT | 0.0046 | 0.0033 | 0.0038 | 0.0021 | 0.0024 | |
| Nordion | 0.0021 | 0.000052 | 0.000067 | 0.00087 | 0.00122 | |
| BTLFootnote 10 | N/A | N/A | N/A | N/A | N/A | |
| SLOWPOKE-2 facilities (Polytechnique Montréal, RMC, SRC)Footnote 11 | 0.00008 | 0.00008 | 0.00008 | 0.00008 | 0.00008 | |
| MNR | <0.001 | <0.001 | <0.001 | <0.001 | <0.001 | |
N/A = not applicable; mSv = millisieverts
I. Environmental Data
This appendix provides environmental data for the UNSPF and RRs.
Blind River Refinery
Atmospheric emissions
The BRR monitors uranium, nitrogen oxides (NOx), nitric acid (HNO3) and particulates released from the facility stacks. The monitoring data in table I-1 demonstrates that atmospheric emissions from the facility continued to be effectively controlled as annual averages were consistently well below their respective licence limits between 2016 and 2020. No action levels for air emissions were exceeded at any time in 2020.
| Parameter | 2016 | 2017 | 2018 | 2019 | 2020 | Licence limit |
|---|---|---|---|---|---|---|
| Dust collection and exhaust ventilation stack: uranium (kg/h) | 0.00005 | 0.00004 | 0.00005 | 0.00005 | 0.00005 | 0.1 |
| Absorber stack: uranium (kg/h) | 0.00001 | 0.00001 | 0.00001 | 0.00001 | 0.00001 | 0.1 |
| Incinerator stack: uranium (kg/h) | <0.00001 | <0.00001 | <0.00001 | <0.00001 | <0.00001 | 0.01 |
| NOX + HNO3 (kg NO2/h) | 1.6 | 1.8 | 2.3 | 3.3 | 3.2 | 56.0 |
| Particulate (kg/h) | 0.006 | 0.008 | 0.010 | 0.012 | 0.010 | 11.0 |
HNO3 = nitric acid; NO2 = nitrogen dioxide; NOx = nitrogen oxide
Note: Results less than detection limit are denoted as "<".
Liquid effluent
There are 3 sources of allowable liquid effluent from the BRR facility: plant effluent, storm water runoff and sewage treatment plant effluent. These effluents are collected in lagoons and treated, as required, bprior to discharge into Lake Huron. Cameco monitors uranium, radium-226, nitrates and pH in liquid effluents to demonstrate compliance with their respective licence limits. No action levels for liquid effluents were exceeded at any time in 2020.
Table I-2 summarizes the average monitoring results from 2016 to 2020. For 2020, the liquid discharges from the facility continued to be within their respective licensed limits.
| Parameter | 2016 | 2017 | 2018 | 2019 | 2020 | Licence limit |
|---|---|---|---|---|---|---|
| Uranium (mg/L) | 0.01 | 0.01 | 0.01 | 0.01 | 0.01 | 2 |
| Nitrates (mg/L) | 11 | 14 | 20 | 21 | 19 | 1,000 |
| Radium-226 (Bq/L) | 0.01 | 0.01 | 0.01 | 0.01 | 0.01 | 1 |
| pH (min) | 7.3 | 7.3 | 7.3 | 7.2 | 7.0 | Min 6.0 |
| pH (max) | 8.6 | 8.2 | 8.5 | 8.4 | 8.4 | Max 9.5 |
Bq/L = becquerels per litre; mg/L = milligrams per litre
Uranium in ambient air
The concentrations of uranium in the ambient air, as monitored by Cameco’s sampling network around BRR, continued to be consistently low. In 2020, the maximum concentration of uranium in ambient air measured was 0.0077 μg/m3 (east yard), which is well below the MECP’s ambient air quality criteria for uranium of 0.03 μg/m3 [19].
Groundwater monitoring
Cameco has an extensive groundwater monitoring program in place around the facility with 35 monitoring wells: 14 wells located inside the perimeter fence and 21 outside the fenceline. Though not used as a potable water source, uranium concentrations from all the groundwater monitoring wells in 2020 were below Health Canada’s Guidelines for Canadian Drinking Water Quality (GCDWQ) for uranium [20].
The average uranium result from all groundwater samples analyzed decreased in 2020 compared to 2019, as shown in table I-3. This decrease is attributable in part to a lower recorded concentration of uranium in monitoring well #22, located just south of the main UO3 plant building outside the calcination area. Results at well #22 remain relatively stable, ranging between 7 and 14 μg/L.
| Parameter | 2016 | 2017 | 2018 | 2019 | 2020 | GCDWQFootnote 12 |
|---|---|---|---|---|---|---|
| Average uranium concentration (μg/L) | 1.3 | 1.2 | 2.3 | 2.0 | 1.4 | 20 |
| Maximum uranium concentration (μg/L) | 14.0 | 11.0 | 27.0 | 14.0 | 14.0 |
GCDWQ = Guidelines for Canadian Drinking Water Quality; μg/L = micrograms per litre
In 2020, a gap analysis of the BRR’s groundwater protection program was conducted against CSA standard N288.7-15, Groundwater Protection Programs at Class I Nuclear Facilities and Uranium Mines and Mills [21]. Cameco will be submitting an updated groundwater protection program by August 2021 to address the identified gaps and to meet the requirements of CSA N288.7-15 [21].
Surface water monitoring
Cameco continues to monitor surface water for uranium, nitrate, radium-226 and pH at the location of the BRR’s outfall diffuser in Lake Huron. The concentrations of uranium, nitrate, radium-226 and the pH levels in the lake remained well below the Canadian Council of Ministers of the Environment (CCME) Canadian Water Quality Guidelines for the Protection of Aquatic Life [22]. Table I-4 provides surface water monitoring results.
| Parameter | 2016 | 2017 | 2018 | 2019 | 2020 | CCME guidelines | |
|---|---|---|---|---|---|---|---|
| Uranium (μg/L) | Average | <0.8 | <0.7 | <0.7 | <0.7 | <0.7 | 15 |
| Maximum | <0.8 | <0.7 | <0.7 | <0.7 | <0.7 | ||
| Nitrate (mg/L as N) | Average | 0.2 | 0.2 | 0.1 | 0.2 | 0.2 | 13 |
| Maximum | 0.2 | 0.2 | 0.2 | 0.2 | 0.2 | ||
| Radium-226 (Bq/L) | Average | <0.005 | 0.008 | <0.005 | 0.008 | <0.005 | N/A |
| Maximum | <0.005 | 0.008 | <0.005 | 0.008 | <0.005 | ||
| pH | Average | 7.3 | 8.0 | 8.1 | 8.0 | 7.9 | 6.5–9.0 |
| Maximum | 7.7 | 8.3 | 8.2 | 8.3 | 7.9 | ||
Bq/L = becquerel per litre; CCME = Canadian Council of Ministers of the Environment; mg/L = milligrams per litre; μg/L = micrograms per litre
Note: Results below the detection limit are denoted as "<"
Soil monitoring
Cameco collects soil samples at the 0 to 5 cm depth each year and at the 5 to 15 cm depth every 5 years, in order to monitor uranium concentrations in surface soil for long-term effects of air emissions on soil quality due to deposition of airborne uranium on soil in the vicinity of the BRR facility. The 2020 soil monitoring results remained consistent with the respective concentrations detected in previous years as shown in table I-5; that is, that uranium soil concentrations did not appear to increase in the area surrounding the facility.
The maximum uranium soil concentrations measured near the facility was at Ontario’s natural background levels (up to 2.5 μg/g) and well below 23 μg/g, which is the most restrictive soil quality guideline set by the CCME for uranium (for residential and parkland land use) [23]. This data demonstrates that the current BRR operations do not contribute to accumulation of uranium in surrounding soil, and that no adverse consequences to relevant human and environmental receptors are expected.
| Parameter | 2016 | 2017 | 2018 | 2019 | 2020 | CCME guidelines |
|---|---|---|---|---|---|---|
| Average uranium concentration within 1,000 m | 1.5 | 1.6 | 2.0 | 2.1 | 1.4 | 23 |
| Average uranium concentration outside 1,000 m | 0.5 | 0.6 | 0.7 | 1.0 | 0.7 | |
| Maximum uranium concentration | 2.9 | 2.8 | 3.7 | 3.8 | 2.5 |
CCME = Canadian Council of Ministers of the Environment; μg/g = micrograms per gram
Gamma monitoring
A portion of radiological public dose from BRR operations is due to gamma radiation sources. Consequently, monitoring of gamma radiation effective dose rates at the fenceline of the BRR main site and the nearby golf course (the critical receptor location) is essential to ensuring that levels of potential gamma radiation exposure are maintained ALARA. The land immediately outside the perimeter fence continues to be owned and controlled by Cameco. Therefore, Cameco sets an action level for gamma dose rates of 1.0 μSv/h at the north fence only, because the critical receptor location for the gamma component of dose to the public is the neighbouring golf course north of the BRR site. Cameco uses environmental dosimeters which are replaced monthly to measure the effective dose rates for gamma radiation. In 2020, the maximum monthly fenceline gamma measurements at the BRR site was 0.55 μSv/h (east), 0.30 μSv/h (north), 0.90 μSv/h (south) and 1.02 μSv/h (west). All north fenceline results in 2020 were below the action level. These measurements indicate that gamma dose rates are controlled and that the public and Indigenous Nations and communities are protected.
Port Hope Conversion Facility
Atmospheric emissions
Cameco monitors uranium, fluorides and ammonia released from the stacks at the PHCF. The monitoring data in table I-6 demonstrates that the atmospheric emissions from the facility continued to be effectively controlled, as annual averages remained consistently below their respective licence limits from 2016 to 2020.
| Location | Parameter | 2016 | 2017 | 2018 | 2019 | 2020 | Licence limit |
|---|---|---|---|---|---|---|---|
| UF6 plant | Uranium (kg/h) | 0.0012 | 0.0011 | 0.0014 | 0.0027 | 0.0025 | 0.28 |
| Fluorides (kg/h) | 0.0100 | 0.021 | 0.030 | 0.018 | 0.028 | 0.65 | |
| UO2 plant | Uranium (kg/h) | 0.0010 | 0.0005 | 0.0007 | 0.0008 | 0.0006 | 0.24 |
| Ammonia (kg/h) | 1.7 | 1.4 | 1.7 | 2.1 | 2.0 | 58 |
UO2 = uranium dioxide; UF6 = uranium hexafluoride
One action level for fluoride emissions was exceeded on July 13, 2020, due to a burnout of a fluorine inlet valve. This action level exceedance is described in the action levels subsection of section 6.7.
Liquid effluent
Cameco’s operating licence does not allow the discharge of any process waste water effluent from PHCF. In 2020, there were no process liquid discharges from PHCF. Cameco continues to collect and evaporate rather than discharge process liquid effluent.
Cameco does discharge non-process liquid effluent, such as cooling water and sanitary sewer discharges, from PHCF. Cameco monitors these releases in compliance with the requirements of other regulators that have jurisdiction. In 2016 and early 2017, as part of the licence renewal process, a daily sanitary sewage discharge action level of 100 μg uranium per litre (U/L) and a monthly mean release limit of 275 μg U/L were developed and accepted. The sanitary sewage action level was exceeded on multiple occasions from 2017-2019, however, as a result of Cameco’s corrective actions in response to these exceedances, only 1 sanitary sewer action level exceedance occurred in 2020. This action level exceedance is described in the action levels subsection of section 6.7.
CNSC staff concluded that in 2020, Cameco met its licence requirement not to discharge process wastewater effluent and to keep the sanitary sewer discharges below respective release limits.
Uranium in ambient air
Cameco measures uranium in the ambient air as total suspended particulate (TSP) at several locations around the PHCF site to confirm the effectiveness of emission abatement systems and to monitor the impact of the facility on the environment. For 2020, the highest annual average concentration (among the sampling stations) of uranium in ambient air measured was 0.003 μg/ m3, which is well below the MECP’s Ambient Air Quality Criteria for uranium of 0.03 μg/m3 [19].
As a follow up requirement of the Vision in Motion project’s environmental assessment, Cameco monitors for dust generation during the conduct of soil excavation activities. Cameco reported a total of ten ambient station high volume air sampler (hi-vol) exceedances of TSP in 2020. The measurements were above the Environment and Climate Change Canada and MECP 120 μg/m3 TSP dust criteria for visibility. The elevated results were attributed to dry conditions and high winds in relation to remediation work being completed adjacent to Cameco property. There were no impacts to the environment or to the health and safety of people.
Groundwater monitoring
The PHCF long-term groundwater monitoring program includes groundwater level monitoring and groundwater sampling at select wells. Cameco samples groundwater quality at the PHCF in the following monitoring wells:
- 12 active pumping wells on a monthly basis
- 52 monitoring wells in the overburden (soil) on a quarterly basis
- 17 monitoring wells in the bedrock on an annual basis
The pump-and-treat wells have been performing as expected. The operation of the pump-and-treat system has resulted in capture of the contaminant plumes originating under the footprint of the UF6 plant. The pump-and-treat systems continue to reduce the mass of groundwater contaminants entering into the harbour, at rates similar to previous years, as shown in table I-7.
| Parameter | 2016 | 2017 | 2018 | 2019 | 2020 |
|---|---|---|---|---|---|
| Uranium | 22.8 | 34.0 | 27.0 | 27.0 | 22.0 |
| Fluoride | 36.9 | 61.0 | 57.0 | 47.0 | 47.0 |
| Ammonia | 73.6 | 70.0 | 66.0 | 39.0 | 23.0 |
| Nitrate | 42.6 | 56.0 | 124.0 | 69.0 | 60.0 |
| Arsenic | 1.9 | 3.0 | 1.0 | 0.5 | 0.64 |
In 2020, a gap analysis of PHCF’s groundwater protection program was conducted against CSA Standard N288.7-15 [21]. Cameco will be submitting an updated groundwater protection program by October 2021 to address any identified gaps and to meet the requirements of CSA N288.7-15 [21].
Surface water monitoring
The surface water quality in the harbour near the PHCF site has been monitored since 1977 through the analysis of samples collected from the south cooling water intake near the mouth of the Ganaraska River. The trend of surface water quality over time shows improvement since 1977 and very low uranium levels.
Surface water in the harbour is sampled at 13 locations on a quarterly basis. This activity includes the collection of samples at depths slightly below the water surface and slightly above the harbour sediment layer at each location. These sampling locations were restricted beginning in 2018 due to CNL’s remedial harbour activities; however, PHCF has continued to conduct ongoing monitoring of the cooling water intake located in the Port Hope harbour near the mouth of the Ganaraska River. Given its proximity to the harbor outlet, the cooling water intake provides a good indication of the overall water quality in the Port Hope harbour under routine/baseline conditions. Unusual and non-routine circumstances such as the 2018 west turning basin wall failure, CNL harbour isolation works and CNL harbour remedial activities have influenced the Port Hope Harbour water quality. Table I-8 of provides annual average and maximum concentrations of uranium, fluoride, nitrate and ammonia monitored in the harbour water from 2016 to 2020.The maximum uranium concentrations in the cooling water intake have been trending downward in 2020 compared to the previous year.
| Parameter | Value | 2016 | 2017 | 2018 | 2019 | 2020 | CCME guidelines |
|---|---|---|---|---|---|---|---|
| Uranium (μg/L) | Average | 2.6 | 3.3 | 5.2 | 5.1 | 5.0 | 15 |
| Maximum | 10 | 8.8 | 31 | 46 | 12 | ||
| Fluoride (mg/L) | Average | 0.15 | 0.19 | 0.16 | 0.092 | 0.09 | 0.12 |
| Maximum | 0.22 | 0.29 | 0.36 | 0.18 | 0.15 | ||
| Nitrate (mg/L) | Average | 0.85 | 1.0 | 1.0 | 0.95 | 0.92 | 13 |
| Maximum | 1.6 | 2.2 | 1.8 | 1.6 | 1.7 | ||
| Ammonia + ammonium (mg/L) | Average | 0.16 | 0.18 | 0.13 | 0.031 | 0.014 | 0.3 |
| Maximum | 0.58 | 0.40 | 0.47 | 0.21 | 0.14 |
CME = Canadian Council of Ministers of the Environment; mg/L = milligrams per litre; μg/g = micrograms per gram
Soil monitoring
Cameco’s soil monitoring program consists of 5 monitoring locations beyond the facility’s fenceline in Port Hope. Three of these locations are within a 0 to 500 m radius of the facility, while the remaining 2 monitoring locations are within a 500 to 1,000 m radius, and a 1,000 to 1,500 m radius. This includes 1 location (waterworks side yard) remediated with clean soil to avoid interference from historical uranium soil contamination. Cameco takes samples annually at various depths within the soil profile to determine whether the concentration of uranium has changed as compared with previous sample results.
The measured average uranium-in-soil concentrations in 2020 remained similar to those of past years. This suggests that uranium emissions from current PHCF operations do not contribute to accumulation of uranium in soil. Table I-9 provides soil sampling results for the waterworks side yard location from 2016–20. The results have been well below the most restrictive CCME Soil Quality Guidelines for the Protection of Environmental and Human Health [22] for residential and parkland land use (23 μg/g) and within the range of the natural background levels for Ontario (up to 2.5 μg/g).
Cameco has made a commitment to maintain the existing 5 soil monitoring locations and to report the results to the CNSC annually. Reclamation activities, as part of the Port Hope Area Initiative, will provide an opportunity for Cameco to review the locations of its soil monitoring stations throughout the Port Hope community.
| Soil depth (cm) | 2016 | 2017 | 2018 | 2019 | 2020 | CCME guidelines |
|---|---|---|---|---|---|---|
| 0–5 | 1.2 | 0.8 | 0.91 | 0.82 | 0.91 | 23 |
| 5–10 | 1.1 | 0.8 | 0.85 | 0.74 | 0.84 | |
| 10–15 | 1.0 | 0.9 | 0.98 | 0.80 | 0.81 |
CCME = Canadian Council of Ministers of the Environment; μg/g = micrograms per gram
Fluoride monitoring
The impact of fluoride emissions from the PHCF on the environment is determined each growing season. At that time, samples of fluoride-sensitive vegetation are collected and then analyzed for fluoride content. The vegetation sampling program was modified in 2017, when sampling locations were standardized to Manitoba maple locations where clusters of trees were sampled in the vicinity of the PHCF as composite samples versus single location sampling. The results in 2020 as shown in table I-10 continued to be well below the MECP’s "upper limit of normal" guideline of 35 parts per million (ppm).
| Parameter | 2016 | 2017 | 2018 | 2019 | 2020 | MECP guideline* |
|---|---|---|---|---|---|---|
| Fluoride in vegetation (ppm) | 3.0 | 11.0 | 5.0 | 5.0 | 5.0 | 35 |
MECP = Ontario Ministry of the Environment, Conservation and Parks; ppm = parts per million
*MECP "upper limit of normal" guideline
Gamma monitoring
A portion of radiological public dose from PHCF operations is due to gamma radiation sources. Consequently, monitoring gamma radiation effective dose rates at the fenceline of the 2 PHCF sites (site 1 and site 2) is essential to ensuring that levels of potential gamma radiation exposure are maintained ALARA. The gamma radiation effective dose rates for both sites are measured with environmental dosimeters supplied by a licensed dosimetry service using specific fenceline monitoring locations.
The 2016 annual average of doses for gamma are shown in table I-11. The 2017, 2018, 2019, and 2020 maximum monthly doses for gamma are shown in table I-12. Results from 2016 are reported in a separate table, since a fenceline gamma monitoring location was included closer to the operating facility in 2017 than that previously used in public dose calculations. The results beginning in 2017 should not be compared to previous years due to this change. The measurements indicate that gamma dose rates are ALARA and the public is protected.
The fenceline gamma action level at station 31 was exceeded on 2 occasions on April 30 and May 31, 2020. These action level exceedances are described in the action levels subsection of section 6.7.
| Parameter | 2016 | Licence limit |
|---|---|---|
| Site 1 (main faciltity) (μSv/h) | 0.005 | 0.14 |
| Site 2 (Dorset Street) (μSv/h) | 0.054 | 0.40 |
μSv/h = microsieverts per hour
| Station number and site | 2017 | 2018 | 2019 | 2020 | Licence limit |
|---|---|---|---|---|---|
| Station 2 - Sites 1 and 2 (μSv/h) | 0.25 | 0.26 | 0.20 | 0.20 | 0.57 |
| Station 13Footnote 13/10 - Site 1 (μSv/h) | 0.0312 | 0.0712 | 0.012/0.05 | 0.11 | 0.4012/0.61 |
| Station 21 - Site 2 (μSv/h) | 0.08 | 0.07 | 0.06 | 0.09 | 0.26 |
μSv/h = microsieverts per hour
Cameco Fuel Manufacturing Inc.
Atmospheric emissions
Cameco continued to monitor uranium released as atmospheric emissions from the facility. The monitoring data in Table I-13 demonstrates that stack and building exhaust ventilation emissions from the facility continued to be effectively controlled as annual averages remained consistently well below their licence limits between 2016 and 2020.
| Parameter | 2016 | 2017 | 2018 | 2019 | 2020 | Licence limit |
|---|---|---|---|---|---|---|
| Total uranium discharge through stacks (kg/year) | 0.03 | 0.01 | 0.01 | 0.004 | 0.01 | 14 |
| Total uranium discharge through building exhaust ventilation (kg/year) | 0.70 | 0.57 | 1.25 | 1.09 | 0.92 |
Starting in 2018, the annual uranium discharge through building exhaust ventilation was calculated by using a summation of the daily release values with a total sum provided for the year. This capability was built into the CFM facility’s new environmental monitoring software and is a better reflection of day-to-day operations compared to using an average result. Previously, the annual value was calculated by adding the quarterly results (2016 and 2017) and using the annual average (2015). This caused the 2018 and subsequent annual results to be higher when compared with those of previous years due to the number of days used in the annual calculation compared to the number of days used in the quarterly calculation. The summation of the daily values is more representative of the actual building ventilation emissions. No action levels for atmospheric emissions were exceeded at any time in 2020.
Liquid effluent
After liquid effluent generated from the production process is collected, an evaporator process is used to remove the majority of the uranium. The condensed liquid is sampled and analyzed prior to a controlled release to the sanitary sewer line. Cameco continues to monitor uranium released as liquid effluent from the facility. The monitoring data in table I-14 demonstrates that liquid effluent from the facility in 2020 remained consistently well below the licence limit and continued to be effectively controlled. No action levels for liquid effluent were exceeded at any time in 2020.
| Parameter | 2016 | 2017 | 2018 | 2019 | 2020 | Licence limit |
|---|---|---|---|---|---|---|
| Total uranium discharge to sewer (kg/year) | 0.85 | 0.64 | 0.84 | 0.39 | 0.34 | 475 |
Uranium in ambient air
Cameco operates high-volume air samplers to measure the airborne concentrations of uranium at points of impingement of stack plumes. The samplers are located on the east, north, southwest and northwest sides of the facility. In 2020, the results from these samplers showed that the highest annual average concentration of uranium in ambient air (among the sampling stations) was 0.0024 μg/m3. This is well below MECP’s Ambient Air Quality Criteria for uranium of 0.03 μg/m3 [20].
Groundwater monitoring
CFM has a network of 70 monitoring wells, including 43 overburden, 23 shallow bedrock and 4 deep bedrock wells. Groundwater has been monitored at the site twice a year since 1999 and up to 10 pumping wells and 2 sumps were in operation during 2020. Table I-15 provides annual average and maximum concentrations of dissolved uranium in groundwater from 2016 to 2020.
| Parameter | 2016 | 2017 | 2018 | 2019 | 2020 | MOE standard |
|---|---|---|---|---|---|---|
| Average dissolved uranium concentration (μg/L) | 58 | 73 | 78 | 115 | 107 | 420 |
| Maximum dissolved uranium concentration (μg/L) | 1700 | 1900 | 2200 | 2300 | 2100 |
MOE = Ontario Ministry of the Environment; μg/g = micrograms per litre
The exceedances of the MOE standard [24] occurred at the same 3 monitoring well locations every year and are related to historic site soil impacts. In the direction of groundwater flow, the closest property boundary (non-residential) is approximately 120 to 140 meters from these 3 monitoring wells. The potential for offsite migration of uranium through groundwater migration is very low. The groundwater monitoring results confirmed that current operations are not contributing to the concentrations of uranium in groundwater on the licensed property.
In 2020, a gap analysis of CFM’s groundwater protection program was conducted against CSA standard N288.7-15 [20]. Cameco will be submitting an updated groundwater protection program by October 2021 to address any identified gaps and to meet the requirements of CSA standard N288.7 [20].
Surface water monitoring
In 2020, Cameco collected surface water samples at 9 locations in April, June, and October. The sample locations were on and adjacent to the facility, and were analyzed for uranium.
The total uranium concentrations in surface water met the interim provincial water quality objective of 5 μg/L [25] at all surface water sampling locations except at the intermittent drainage locations SW-4 (April and August 2020) and SW-9 (April and August 2020). All surface water samples met the CCME short-term uranium guideline of 33 μg/L [22] in the intermittent drainage locations. There was 1 exceedance of the CCME long-term uranium guideline of 15 μg/L [22] in the Gages Creek tributary at location
SW-9 (April 2020). The risk to the environment from an exceedance of a CCME water quality guideline is expected to be minimum due to the conservative assumptions and safety factors that were used to derive the guideline.
CNSC staff will continue to oversee Cameco’s monitoring at locations around the vicinity of CFM to confirm that uranium concentrations remain at safe levels in surface water.
Soil monitoring
Every 3 years, Cameco collects soil samples at the 0 to 5 cm depth from 23 locations surrounding the CFM facility. Soil samples were last collected in 2019 and analyzed for uranium content. The soil monitoring results are shown in table I-16. The 2019 average uranium concentration in soil near the CFM facility is within the Ontario natural background level of up to 2.5 μg/g. The maximum concentrations detected are attributable to historical contamination in Port Hope, which has long been recognized and continues to be the focus of environmental studies and cleanup activities. The results for all samples were below the CCME Soil Quality Guidelines for the Protection of Environmental and Human Health [22] of 23 μg/g. This is the most restrictive guideline; therefore, no adverse consequences to human and environmental receptors are expected. The next soil samples will be collected in 2022.
| Parameter | 2009 | 2010 | 2013 | 2016 | 2019 | CCME guideline |
|---|---|---|---|---|---|---|
| Average uranium concentration (μg/g) | 5.2 | 4.5 | 3.7 | 2.5 | 2.4 | 23 |
| Maximum uranium concentration (μg/g) | 17.0 | 21.1 | 17.4 | 11.2 | 7.6 | 23 |
CCME = Canadian Council of Ministers of the Environment; μg/g = microgram per gram
Gamma monitoring
For the CFM facility, a portion of radiological public dose is due to gamma radiation sources. Consequently, monitoring of gamma radiation effective dose rates at the fenceline of the CFM site is essential to ensuring that levels of potential gamma radiation exposure are maintained ALARA. The gamma radiation effective dose rates for the site are measured with environmental dosimeters supplied by a licensed dosimetry service. In 2020, the annual average of gamma measurements at location 1 (the critical receptor location) was 0.006 μSv/h. The highest average at the other monitoring locations was 0.34 μSv/h. CFM has a licensed limit for fenceline gamma dose rates of 0.35 μSv/h at location 1 and 1.18 μSv/h at all other monitoring locations. No licence limits were exceeded in 2020.
In addition to licence limits, CFM has action levels for the critical receptor and other locations. There were no exceedances of the action levels in 2020.
BWXT Nuclear Energy Canada Inc. – Toronto & Peterborough
Atmospheric emissions
To ensure compliance with licence limits, air emissions from the BWXT NEC facilities are filtered and sampled prior to its release into the atmosphere. Table I-17 provides BWXT-NEC Toronto’s annual maximum uranium emissions from 2016 to 2020. Table I-18 provides BWXT-NEC Peterborough’s annual maximum uranium and beryllium emissions from 2016 to 2020. The annual emissions remained well below the licence limits for both facilities.
In 2020, BWXT-NEC established new exposure-based release limits (EBRLs) for air which are concentration-based release limits that take into consideration the most restrictive endpoint parameters (radiotoxicity and chemical toxicity). These are listed as licence limits in both tables. No action levels for atmospheric emissions were exceeded at any time in 2020. The results demonstrate that air emissions of uranium and beryllium were being controlled effectively.
| Parameter | Stack | 2016 | 2017 | 2018 | 2019 | 2020 | Licence limit |
|---|---|---|---|---|---|---|---|
| Uranium (μg/m3) | Rotoclone | 0.355 | 0.180 | 0.464 | 0.077 | 0.204 | 65 |
| 6H-68 | 0.145 | 0.160 | 0.118 | 0.111 | 0.112 | 47 | |
| 4H-48 | 0.500 | 0.130 | 0.086 | 0.037 | 0.112 | 97 | |
| Furnace #1 | 0.105 | 0.440 | 0.112 | 0.081 | 0.599 | 437 | |
| Furnace #2/4 | 0.809 | 0.150 | 0.092 | 0.103 | 0.158 | 55 | |
| Furnace #5/6 | 0.132 | 0.230 | 0.467 | 0.245 | 0.908 | 52 |
μg/m3= microgram per cubic metre
| Parameter | Stack | 2016 | 2017 | 2018 | 2019 | 2020 | Licence limit |
|---|---|---|---|---|---|---|---|
| Uranium (μg/m3) | R2 Decan | 0.012 | 0.003 | 0.006 | 0.014 | 0.003 | 410 |
| Beryllium (μg/m3) | North | 0.001 | 0.001 | 0.001 | 0.001 | 0.001 | 2.6 |
| South | 0.001 | 0.001 | 0.001 | 0.001 | 0.001 | ||
| Acid | 0.002 | 0.001 | 0.000 | 0.000 | 0.000 |
μg/m3= microgram per cubic metre
Liquid effluent
To ensure compliance with licence limits, wastewater from the BWXT-NEC Toronto and Peterborough facilities is collected, filtered and sampled prior to its release into sanitary sewers. Table I-19 provides BWXT-NEC’s annual maximum concentrations of uranium and beryllium released to the sanitary sewers from 2016 to 2020. In 2020, the releases continued to be well below the licence limits demonstrating that liquid effluent releases were being controlled effectively
In 2020, BWXT-NEC established new EBRLs for water which are concentration-based release limits that take into consideration the most restrictive endpoint parameters (radiotoxicity, chemical toxicity, and protection of aquatic life). These are listed as licence limits in both tables.
BWXT-NEC Toronto had multiple exceedances of pH action levels in 2020. These action level exceedances are described in the action levels subsection of section 6.7.
| Facility | Parameter | 2016 | 2017 | 2018 | 2019 | 2020 | Licence limit |
|---|---|---|---|---|---|---|---|
| BWXT-NEC Toronto | Uranium | 2.80 | 2.56 | 2.95 | 2.58 | 2.79 | 1000 |
| BWXT-NEC Peterborough | Uranium | 0.48 | 0.09 | 0.03 | 0.07 | 0.37 | 2500 |
| Beryllium | 0.0025 | 0.0054 | 0.0025 | 0.0018 | 0.0091 | 26 |
Uranium in ambient air
BWXT-NEC Toronto operates 5 high-volume air samplers to measure the airborne concentrations of uranium at points of impingement of stack plumes. The results from these samplers show that the annual average concentration of uranium (among the sampling stations) in ambient air measured around the facility in 2020 was below the minimum detection limit and therefore is reported as zero. This demonstrates that the results are well below MECP’s Ambient Air Quality Criteria for uranium of 0.03 μg/m3 [20]. Table I-20 provides air monitoring results for BWXT-NEC Toronto.
BWXT-NEC Peterborough does not monitor uranium in ambient air because the atmospheric emissions discharged from the facility already meet the MECP standard
of 0.03 μg/m3 at the point of release, thus eliminating the need for additional ambient monitoring.
| Parameter | 2016 | 2017 | 2018 | 2019 | 2020 |
|---|---|---|---|---|---|
| Average concentration (μg/m3) | 0.001 | 0.000 | 0.000 | 0.000 | 0.000 |
μg/m3= microgram per cubic metre
Groundwater and surface water monitoring
There is no groundwater or surface water monitoring program at the BWXT-NEC facilities. Liquid effluent from the BWXT-NEC facilities are sampled and analyzed as part of the effluent monitoring programs before being discharged to the sanitary sewers. There are no direct discharges to surface water bodies.
The GE Hitachi complex in Peterborough currently monitors surface water and groundwater for PCBs and trichloroethlylene (historical contaminants not associated with BWXT-NEC operations).
Given the low concentrations of beryllium and uranium in stormwater runoff and the absence of any significant soil or groundwater contamination onsite, pathways associated with groundwater are also not considered pathways of concern at BWXT-NEC Toronto and Peterborough, as stated in the ERA.
Soil monitoring
BWXT-NEC conducts soil sampling for uranium at its Toronto facility as part of its environmental program. In 2020, soil samples were taken from 49 locations and analyzed for uranium content. The samples were collected on the BWXT-NEC Toronto site, on commercial lands located along the south border of the site and in the nearby residential neighbourhood. In 2020, the measured soil concentrations of uranium ranged from <1.0 μg/g at a residential location to 17.6 μg/g on commercial lands. Regardless of sampling location (i.e., onsite, commercial residential), all samples were below the most stringent soil guideline (i.e. CCME Soil Quality Guidelines for the Protection of Environmental and Human Health [22] for uranium for industrial, commercial and residential/parkland land use).
BWXT-NEC conducted soil sampling for beryllium in 2020 around the Peterborough facility as committed in the CNSC licence renewal hearing. In 2020, soil samples were taken from 21 locations that were selected for consistency with the CNSC’s IEMP.
Of the 21 samples, 19 samples submitted were non-detectable, with results below the laboratory reported detection limit (<0.5 μg/g). The 2 samples that were detected ranged from 0.5 μg/g to 0.52 μg/g.
All samples fell well below Ontario’s background concentrations of up to 2.5 μg/g and well below the applicable CCME Soil Quality Guidelines for the Protection of Environmental Health and Human Health [22]. Samples were measured at 4 mg/kg for environmental health, and 75 mg/kg for human health).
Tables I-21, I-22, I-23, and I-24 provide soil sampling results. The data demonstrates that the current BWXT-NEC operations at Toronto and Peterborough do not contribute to the accumulation of uranium or beryllium in surrounding soil, and that no adverse consequences to relevant human and environmental receptors are expected.
| Parameter | 2016 | 2017 | 2018 | 2019 | 2020 |
|---|---|---|---|---|---|
| Number of samples | 1 | 1 | 1 | 1 | 1 |
| Average uranium concentration (μg/g) | 1.2 | 1.7 | 1.3 | 1.2 | 1.3 |
| CCME guideline (μg/g) | 300 | ||||
CCME = Canadian Council of Ministers of the Environment; μg/g = micrograms per gram
| Parameter | 2016 | 2017 | 2018 | 2019 | 2020 |
|---|---|---|---|---|---|
| Number of samples | 34 | 34 | 34 | 34 | 34 |
| Average uranium concentration (μg/g) | 2.7 | 3.0 | 2.3 | 1.5 | 2.9 |
| Maximum uranium concentration (μg/g) | 13.6 | 20.6 | 11.9 | 2.8 | 17.6 |
| CCME guideline (μg/g) | 33 | ||||
CCME = Canadian Council of Ministers of the Environment; μg/g = micrograms per gram
| Parameter | 2016 | 2017 | 2018 | 2019 | 2020 |
|---|---|---|---|---|---|
| Number of samples | 14 | 14 | 14 | 14 | 14 |
| Average uranium concentration (μg/g) | 0.5 | 1.0 | < 1.0 | 1.1 | 1.0 |
| Maximum uranium concentration (μg/g) | 0.7 | 1.6 | < 1.0 | 1.7 | 1.0 |
| CCME guidelines (μg/g)* | 23 | ||||
CCME = Canadian Council of Ministers of the Environment; μg/g = micrograms per gram
| Parameter | 2020 |
|---|---|
| Number of samples | 21 |
| Average beryllium concentration (μg/g) | 0.50 |
| Maximum beryllium concentration (μg/g) | 0.52 |
| CCME guidelines (μg/g)* | 4.0 |
CCME = Canadian Council of Ministers of the Environment; μg/g = microgram per gram
Gamma monitoring
A portion of radiological public dose from both the BWXT-NEC Toronto and Peterborough facilities is due to gamma radiation sources. Consequently, it is necessary to monitor gamma radiation effective dose rates at the fenceline of the Toronto site and at the Peterborough facility boundary to ensure that levels of potential gamma radiation exposure are maintained ALARA.
Since 2014, BWXT-NEC has used environmental dosimeters to measure the effective dose rates for gamma radiation for the Toronto site. In 2020, the radiation dose from direct gamma radiation was 5.7 μSv.
Since 2016, the gamma radiation effective dose rate for the BWXT-NEC Peterborough facility has also been measured with environmental dosimeters. In 2020, the radiation dose from direct gamma radiation was 0.0 μSv.
These estimates indicate that gamma doses from both BWXT-NEC facilities are controlled, ALARA and that the public is protected.
SRB Technologies (Canada) Inc.
Atmospheric emissions
SRBT monitors tritium releases from the facility stacks and reports them on an annual basis. The monitoring data for 2016 through 2020, provided in table iodine-25, demonstrates that atmospheric emissions from the facility remained below their regulatory limits.
| Parameter | 2016 | 2017 | 2018 | 2019 | 2020 | Licence limit (GBq/year) |
|---|---|---|---|---|---|---|
| Tritium as tritium oxide (HTO) (GBq/year) | 6,293 | 7,198 | 10,741 | 11,858 | 9,755 | 67,200 |
| Total tritium as HTO + HT (GBq/year) | 28,945 | 24,822 | 33,180 | 31,769 | 25,186 | 448,000 |
GBq = gigabecquerels; HTO = hydrogenated tritium oxide; HT = tritium gas
Liquid effluent
SRBT continues to control and monitor tritium released as liquid effluent from the facility to the sewer. The monitoring data for 2016 through 2020, provided in table iodine-26, demonstrates that liquid effluent from the facility remained below their regulatory limits.
| Parameter | 2016 | 2017 | 2018 | 2019 | 2020 | Licence limit (GBq/year) |
|---|---|---|---|---|---|---|
| Tritium-water soluble (GBq/year) | 5.18 | 6.85 | 10.02 | 13.67 | 5.56 | 200 |
GBq = gigabecquerels
Tritium in ambient air
SRBT has 40 passive air samplers located within a 2-km radius of the facility. These samplers represent tritium exposure pathways for inhalation and skin absorption, and are used in the calculations to determine public dose. In 2020, SRBT converted to analyzing the passive air samples in-house with approved procedures. This change was implemented due to the former third-party service provider becoming unavailable during the COVID-19 pandemic. The 2020 air monitoring results from these samplers demonstrated that tritium levels in ambient air near SRBT remain low.
Groundwater monitoring
Sampling wells are used to establish tritium concentrations in the groundwater each month at various depths and in differing geologic strata. From the 2020 sampling results, the highest average tritium concentration was reported for monitoring well MW06-10 (29,513 Bq/L, with a minimum monthly total of 17,231 Bq/L in June, and a maximum of 43,247 Bq/L in February), which is approximately 15% lower than the average measured in 2019 (34,592 Bq/L). This well is located directly beneath the area where the active ventilation stacks are located. This well is a dedicated, engineered groundwater monitoring well very near to the facility within a secured area, and is not available to be used as a source of water consumption. Throughout 2020, no other wells exceeded the Ontario drinking water standard for tritium of 7,000 Bq/L. The annual average tritium concentrations in groundwater are provided in figure I-1.
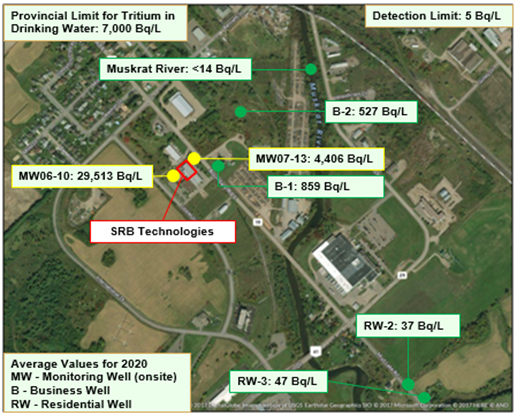
Figure I-1: Text version
| Muskrat River and groundwater monitoring wells | Tritium concentration (Bq/L) | Exceed or below provincial limit* |
|---|---|---|
| Muskrat River | Below 14 | Below |
| MW06-10 | 29,513 | Exceed |
| MW07-13 | 4,406 | Below |
| B-1 | 859 | Below |
| B-2 | 527 | Below |
| RW-2 | 37 | Below |
| RW-3 | 47 | Below |
*The provincial limit for tritium in drinking water is 7,000 Bq/L.
Tritium concentrations decrease significantly at locations farther away from SRBT. In 2020, tritium concentrations in the sampled business wells were 938 Bq/L or less, and those in the sampled residential wells were 49 Bq/L, far below Ontario’s drinking quality standard of 7,000 Bq/L. All of residential wells are over 1 km away from SRBT and are not in the groundwater flow pathway.
In 2020, SRBT converted to analyzing Muskrat River samples in-house with approved procedures. This change was implemented due to the former third-party service provider becoming unavailable during the COVID-19 pandemic. Tritium concentrations in Muskrat River (the receiving surface water environment about 420 m from the SRBT property) in 2020 fell below the minimum detectable activity, as they were in 2019.
Overall, CNSC staff concluded that the tritium inventory in the groundwater system around the facility has been trending downward since 2006. This trend is due to SRBT’s initiative to reduce emissions, including the commissioning of improved tritium trap valves and remote display units, the real-time monitoring of gaseous effluent, and a reduction in the amount of failed leak tests of manufactured light sources. Along with the reduced emissions, the concentration of tritium in the groundwater is decreasing due to the natural decay of tritium and the flushing of historical tritium emissions through the groundwater system. Since 2016, SRBT has been in compliance with CSA N288.7-15, Groundwater Protection Programs at Class I Nuclear Facilities and Uranium Mines and Mills [20].
Other monitoring
SRBT also samples and analyzes runoff water from its facility, and engages a qualified third party to perform monitoring and analysis of precipitation, surface water, produce, milk and wine. The 2020 monitoring data for these items remain low. This monitoring complements the principal monitoring activities, which focus on air and groundwater.
Nordion (Canada) Inc.
Atmospheric emissions
Nordion continues to control and monitor the releases of radioactive materials from its facility to prevent unnecessary releases of radioisotopes to the atmosphere. Table I-27 shows Nordion’s radioactive air emissions monitoring results from 2016 to 2020.
The monitoring data demonstrates that the radioactive air emissions from the facility in 2020 remained below the regulatory limits In November 2016, Nordion ceased the production of molybdenum-99, iodine-125, iodine-131 and xenon-133, which resulted in it having zero releases of radioiodine and noble gases in 2020. In addition, there were no detectable air releases for cobalt-60 in 2020.
| Parameter | 2016 | 2017 | 2018 | 2019 | 2020 | Licence limit (DRL) (GBq/year) |
|---|---|---|---|---|---|---|
| Cobalt-60 | 0.006 | 0.0034 | 0.002 | 0.00002 | 0 | 250 |
| Iodine-125 | 0.21 | 0.0012 | 0 | 0 | 0 | 952 |
| Iodine-131 | 0.35 | 0.0008 | 0.006 | 0 | 0 | 686 |
| Xenon-133 | 7,277 | 0 | 0 | 0 | 0 | 677 million |
| Xenon-135 | 4,299 | 0 | 0 | 0 | 0 | 102 million |
| Xenon-135m | 5,421 | 0 | 0 | 0 | 0 | 69 million |
DRL = derived release limit; GBq = gigabecquerel
Liquid effluent
Nordion continues to collect, sample and analyze all liquid effluent releases before discharge into the municipal sewer system. Table I-28 shows Nordion’s monitoring results for radioactive liquid emissions from 2016 to 2020.
The monitoring data demonstrates that the authorized radioactive liquid effluent releases from the facility in 2020 remained below the regulatory limits.
In 2020, Nordion reported 1 environmental reportable limit exceedance involving non-radiological releases to the sanitary sewer, which resulted in a by-law limit exceedance of suspended solids. This was identified by Nordion during routine sampling and self-reported to the City of Ottawa. CNSC staff concluded that this singular reportable exceedance did not pose undue risk to the environment or human health.
| Parameter | 2016 | 2017 | 2018 | 2019 | 2020 | Licence limit (DRL) (GBq/year) |
|---|---|---|---|---|---|---|
| β < 1 MeV | 0.222 | 0.212 | 0.243 | 0.162 | 0.226 | 763 |
| β > 1 MeV | 0.051 | 0.048 | 0.055 | 0.038 | 0.057 | 35,000 |
| Iodine-125 | 0.144 | 0.145 | 0.146 | 0.063 | 0 | 1,190 |
| Iodine-131 | 0.006 | 0.006 | 0.007 | 0.004 | 0 | 389 |
| Molybdenum-99 | 0.052 | 0.049 | 0.055 | 0.036 | 0 | 10,200 |
| Cobalt-60 | 0.026 | 0.022 | 0.027 | 0.020 | 0.031 | 35.4 |
| Niobium-95 | 0.0010 | 0.0010 | 0.0010 | 0.002 | 0.0015 | 3,250 |
| Zirconium-95 | 0.0015 | 0.0020 | 0.0017 | 0.0019 | 0.0013 | 2,060 |
| Cesium-137 | 0.0007 | 0.0007 | 0.0007 | 0.0007 | 0.00076 | 24.8 |
β < 1 MeV = beta particles less than 1 megaelectronvolt; DRL = derived release limit; GBq = gigabecquerels
Groundwater monitoring
There are currently 9 groundwater monitoring wells on the Nordion site. Since 2005, Nordion has been monitoring groundwater at least once a year for non-radioactive contaminants in 4 monitoring wells. The monitoring results from 2014 to 2020 demonstrate that there were no significant changes in the groundwater in 2020 compared to previous years.
Since 2014, Nordion has been monitoring groundwater at least once a year for radioactive contaminants in 5 monitoring wells. The results since then have detected only naturally occurring radionuclides that are not processed at the Nordion facility.
These results, which are either below detection limits or at natural background levels, indicate that releases of radioactive and hazardous substances from Nordion’s facility have had no measurable impact on groundwater quality.
Nordion has completed a gap analysis against the requirements of CSA N288.7-15 [20] and is continuing to update internal procedures and programs to meet these requirements and fill gaps identified.
Soil sampling
Nordion performed soil sampling in 2020, and no radionuclides attributable to licensed activities were detected in the soil samples.
Environmental thermoluminescent dosimeters program
Nordion monitors environmental gamma radiation using thermoluminescent dosimeters. The dosimeters are deployed at locations to cover the points of a compass and preferentially to the east of the facility, which receives the prevailing west winds. Dosimeters are also placed in residences of Nordion employees located near the facility. The annual monitoring results for 2020 showed that the levels of gamma radiation at offsite monitoring locations are in the range of natural background levels. These results indicate that Nordion’s operations is not contributing to the public’s exposure to gamma radiation at, and beyond, the perimeter of the facility.
Best Theratronics Ltd.
Effluent and emissions control (releases)
BTL has determined that there are no radiological releases (liquid or airborne) at its facility that require controls or monitoring. BTL’s operation uses radioactive sealed sources that do not produce any radioactive releases.
BTL safely manages hazardous liquid effluents from routine operations. They are collected, temporarily stored onsite, and then removed for disposal by a certified third-party contractor. Lubricating oil for onsite boring and milling machines are recovered and recirculated. Therefore, there would be no hazardous waterborne releases into the environment requiring controls or effluent monitoring.
Hazardous airborne emissions from BTL are related to the exhausting of the lead pouring, paint booth, fire torching and sand blasting areas. Engineering controls, such as filters and ventilation, are in place to reduce or eliminate emissions generated during operations.
As a result, BTL does not have an effluent monitoring program or an environmental monitoring program.
Assessment and monitoring
BTL does not conduct environmental monitoring around its facility as there are no radiological releases that require controls or monitoring. Hazardous airborne emissions pertain to exhausting associated with the lead pouring area. BTL submits a report on lead, and its compounds, to the National Pollutant Release Inventory, maintaining annual compliance with the Toxics Reduction Act. There have not been any abnormal releases within the licensing period.
McMaster Nuclear Reactor
Atmospheric emissions
At the MNR, the exhaust ventilation from the reactor building is routinely monitored for iodine-125 and argon-41, which are the only nuclear substances routinely released to the environment in measurable quantities (i.e., above detection limits). Radioactive particulates are also monitored for gross beta to ensure that no unexpected radionuclides are present in the air stream. Samples are collected weekly and analyzed by windowless proportional counting for gross beta and by gamma spectrometry for iodine-125. During operation of the reactor, daily measurements of argon-41 concentrations in the exhaust are made using a gas counting chamber.
Controls are in place to ensure that airborne releases of nuclear substances to the environment are minimized. These include the use of activated charcoal filters to minimize the release of iodine-125, and the use of filters to ensure releases of radioactive particulates are controlled. The annual total airborne releases are shown in appendix G.
DRLs have been established for airborne releases of argon-41 and iodine-125 at the MNR, based on the regulatory public dose limit of 1 mSv/year.
Liquid effluent
At the MNR, the 2 potential pathways for liquid releases are deliberate pump-out from the building sumps to the municipal sewer ,and breakthrough of primary water to the secondary side of the heat exchanger. There were no releases of contaminated liquids to the municipal sewer system in the 2018–20 period. Any liquid effluent generated by the MNR continues to be captured and then it is processed or evaporated in the facility.
Assessment and monitoring
The MNR’s environmental monitoring program consists of several locations surrounding the reactor building to sample for particulates and iodine-125 in air. Samples are collected weekly and analyzed for gross beta activity using a windowless proportional counter. Charcoal cartridges are collected and sampled monthly for iodine-125 via gamma spectrometry. The gaseous effluent monitors and environmental monitoring results at the MNR did not indicate any radiological releases that could compromise the health and safety of persons and the environment.
No supplementary environmental monitoring programs (e.g., groundwater monitoring, surface water monitoring, soil monitoring, etc.) are required at the MNR, based on the licensee’s operations.
Polytechnique Montréal, Royal Military College of Canada and Saskatchewan Research Council SLOWPOKE-2 reactors
Atmospheric emissions
The SLOWPOKE-2 RRs release negligible quantities of radioactive noble gases, mainly xenon-133 and xenon-135, resulting from the weekly purges of reactor head space, and argon-41, due to irradiation activities. The releases take place through filters and a dedicated facility stack, after sampling and analysis of the head space cover gas. Once released to the stack, these quantities are below the threshold of detection capability.
Due to the negligible quantities that are released and the minimal impact to the environment and to people, CNSC staff determined that no formal release limits are necessary for the SLOWPOKE-2 RRs.
During the SRC SLOWPOKE-2 decommissioning, SRC used alpha/beta integrated continuous air monitoring to monitor for any potential radioactive emissions. Throughout the entire decommissioning process, there were no detectable concentrations of airborne radioactivity above normal background.
Liquid effluent
The RR facilities do not generate any liquid effluent during normal operations.
The SRC SLOWPOKE-2 RR did generate some liquid effluent during its decommissioning in the form of the reactor pool water. The water was treated through an ion exchange column to reduce radioactivity. CNSC staff reviewed SRC’s analyses of radionuclides in the their liquid effluent and compared them against the clearance levels in appendix R of REGDOC-1.6.1 [26], as well as the exposure-based release limit derived using the methodology in CSA N288.1-14, Guidelines For Calculating Derived Release Limits for Radioactive Materials in Airborne And Liquid Effluents for Normal Operation of Nuclear Facilities [18]. These conditional clearance levels are based on a member of the public receiving a dose of 0.01 mSv/yr. CNSC staff also reviewed the results of the hazardous substances and compared them against the limits in schedule "B" of the City of Saskatoon’s sewer use bylaw. CNSC staff confirmed that all of the results were below their respective conditional clearance levels or release limits. Thus, CNSC staff concluded that the pool water could be discharged to the city sewer without any impacts to workers, human health, and the environment.
Assessment and monitoring
Environmental monitoring programs are not required for SLOWPOKE-2 RRs because the estimated dose to public is several orders of magnitude below the regulatory public dose limit, and the dose rates to non-human ecological receptors are orders of magnitude lower than conservative benchmarks.
The operations of the SLOWPOKE-2 RRs also do not result in any releases of hazardous substances to the environment. Thus, there is no requirement to monitor hazardous substances.
J. Worker Dose Data
This appendix presents information on doses to nuclear energy workers (NEWs) and non-NEWs at UNSPF and RRs.
Blind River Refinery
Figure J-1 provides the average and maximum effective doses for NEWs at the BRR between 2016 and 2020. The maximum effective dose received by a NEW in 2020 was 10.1 mSv, which is approximately 20% of the CNSC’s regulatory effective dose limit of 50 mSv in a 1-year dosimetry period. Average and maximum effective doses over this 5-year period are reflective of the work activities at the BRR, and influenced by factors such as production levels and number of operating days. The average and maximum effective doses are trending higher in 2020, attributable to production rates. The NEW with the maximum effective dose also worked primarily in processing areas that had the highest gamma and beta dose rates at the BRR, contributing to the majority of their effective dose during the year.
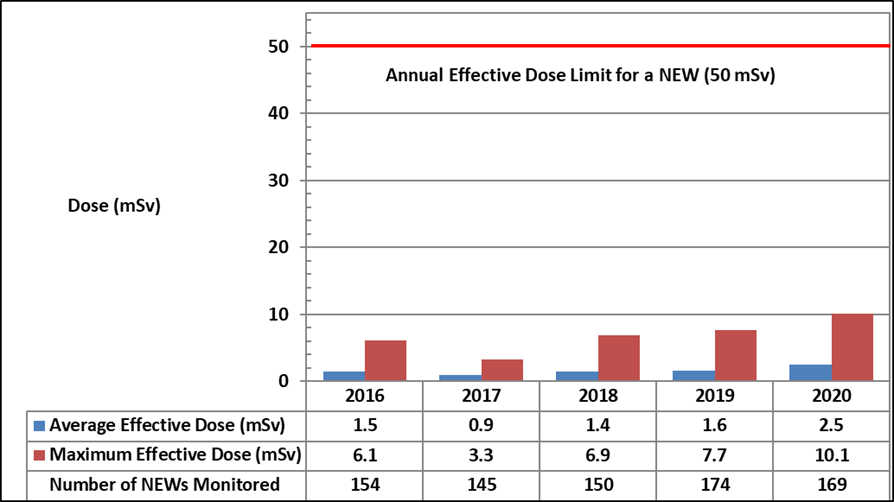
Figure J-1: Text version
| Dose statistic | 2016 | 2017 | 2018 | 2019 | 2020 |
|---|---|---|---|---|---|
| Average effective dose (mSv) | 1.5 | 0.9 | 1.4 | 1.6 | 2.5 |
| Maximum effective dose (mSv) | 6.1 | 3.3 | 6.9 | 7.7 | 10.1 |
| Number of nuclear energy workers monitored | 154 | 145 | 150 | 174 | 169 |
Note: The regulatory limit for effective dose to a nuclear energy worker is 50 mSv/year.
For the 5-year dosimetry period that began January 1, 2016, and concluded on December 31, 2020, the maximum cumulative effective dose received by a NEW at the BRR was 31.7 mSv. This effective dose result represents approximately 32% of the CNSC’s regulatory dose limit of 100 mSv in a 5-year dosimetry period.
Average and maximum equivalent dose results for the skin and extremities of NEWs, from 2016 to 2020, are provided in tables J-1 and J-2. In 2020, the maximum individual skin dose received by a NEW at the BRR was 39.1 mSv, which is approximately 8% of the CNSC’s regulatory equivalent dose limit of 500 mSv in a 1-year dosimetry period. The maximum individual extremity dose received by a NEW at the BRR was 14.5 mSv, which is approximately 3% of the CNSC’s regulatory equivalent dose limit of 500 mSv in a 1-year dosimetry period. The average and maximum equivalent doses have been relatively steady over this 5-year period. There was an increase in the maximum skin dose for a NEW in 2020. This NEW worked primarily in processing areas that had the highest gamma and beta dose rates at the BRR, and was also the same NEW with the maximum individual effective dose in 2020.
| Dose data | 2016 | 2017 | 2018 | 2019 | 2020 | Regulatory limit |
|---|---|---|---|---|---|---|
| Average skin dose (mSv) | 3.3 | 3.1 | 4.1 | 4.8 | 5.1 | N/A |
| Maximum individual skin dose (mSv) | 26.0 | 16.2 | 28.4 | 29.2 | 39.1 | 500 mSv/year |
mSv = millisievert; N/A = not applicable
| Dose data | 2016 | 2017 | 2018 | 2019 | 2020 | Regulatory limit |
|---|---|---|---|---|---|---|
| Average extremity dose (mSv) | 1.2 | 1.0 | 3.5 | 3.9 | 3.4 | N/A |
| Maximum individual extremity dose (mSv) | 10.6 | 13.6 | 14.5 | 11.9 | 14.5 | 500 mSv/year |
mSv = millisievert; N/A = not applicable
Non-NEWs at the BRR
Site visitors and contractors that are not considered NEWs are issued external dosimetry to monitor their radiological exposures while at BRR. In 2020, the maximum individual effective dose received by a site visitor or contactor that was not a NEW was 0.15 mSv, which is well below the CNSC’s regulatory effective dose limit of 1 mSv per calendar year for a person who is not a NEW.
Port Hope Conversion Facility
Figure J-2 provides the average and maximum effective doses for NEWs at the PHCF between 2016 and 2020. The maximum individual effective dose received by a NEW in 2020 was 5.5 mSv, which is approximately 11% of the CNSC’s regulatory effective dose limit of 50 mSv in a 1-year dosimetry period. The average and maximum total effective doses over this 5-year period have remained steady, and are reflective of the work activities and production levels at PHCF.
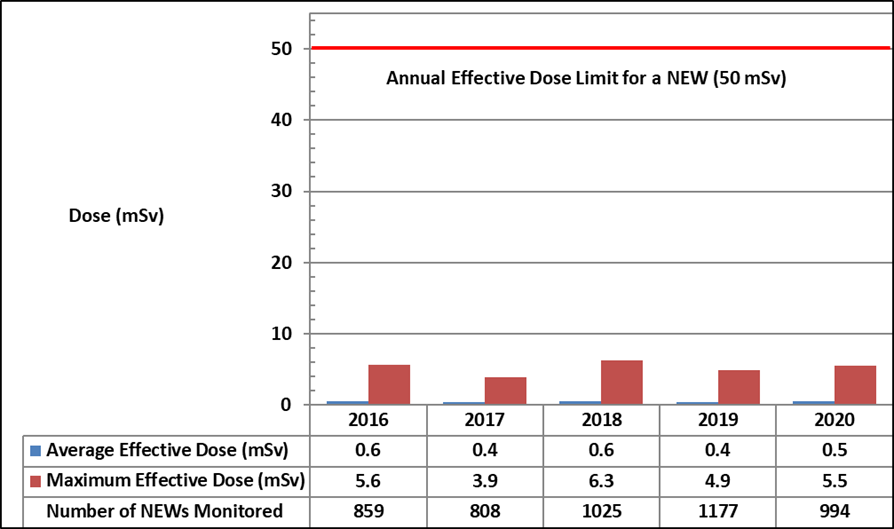
Figure J-2: Text version
| Dose statistic | 2016 | 2017 | 2018 | 2019 | 2020 |
|---|---|---|---|---|---|
| Average effective dose (mSv) | 0.6 | 0.4 | 0.6 | 0.4 | 0.5 |
| Maximum effective dose (mSv) | 5.6 | 3.9 | 6.3 | 4.9 | 5.5 |
| Number of nuclear energy workers monitored | 859 | 808 | 1,025 | 1,177 | 994 |
Note: The regulatory limit for effective dose to a nuclear energy worker is 50 mSv/year.
For the 5-year dosimetry period that began January 1, 2016, and concluded on December 31, 2020, the maximum cumulative effective dose received by a NEW at PHCF was 20.6 mSv. This effective dose result represents approximately 21% of the CNSC’s regulatory dose limit of 100 mSv in a 5-year dosimetry period.
Average and maximum equivalent dose results for the skin of NEWs, from 2016 to 2020, are provided in table J-3. In 2020, the maximum individual skin dose received by a NEW at the PHCF was 17 mSv, which is approximately 3% of the CNSC’s regulatory equivalent dose limit of 500 mSv in a 1-year dosimetry period. The average and maximum skin doses over this 5-year period have been relatively steady.
| Dose data | 2016 | 2017 | 2018 | 2019 | 2020 | Regulatory limit |
|---|---|---|---|---|---|---|
| Average skin dose (mSv) | 0.8 | 0.6 | 0.7 | 0.5 | 0.5 | N/A |
| Maximum individual skin dose (mSv) | 16.9 | 13.7 | 14.9 | 20.1 | 17.0 | 500 mSv/year |
mSv = millisieverts; N/A = not applicable
Non-NEWs at the PHCF
Cameco employees, site visitors and contractors whose work activities do not require NEW status may be issued whole-body dosimeters and may participate in the internal dosimetry program to monitor their radiological exposures while at PHCF. In 2020, the maximum individual effective dose received by a person who is not a NEW was 0.04 mSv, which is well below the CNSC’s regulatory effective dose limit of 1 mSv per calendar year for a person who is not a NEW.
Cameco Fuel Manufacturing Inc.
Figure J-3 provides the average and maximum effective doses for NEWs at CFM between 2016 and 2020. The maximum individual effective dose received by a NEW in 2020 was 6.2 mSv, which is approximately 12% of the CNSC’s regulatory effective dose limit of 50 mSv in a 1-year dosimetry period The average and maximum total effective doses over this 5-year period have remained steady, and are reflective of the work activities and production levels at CFM.
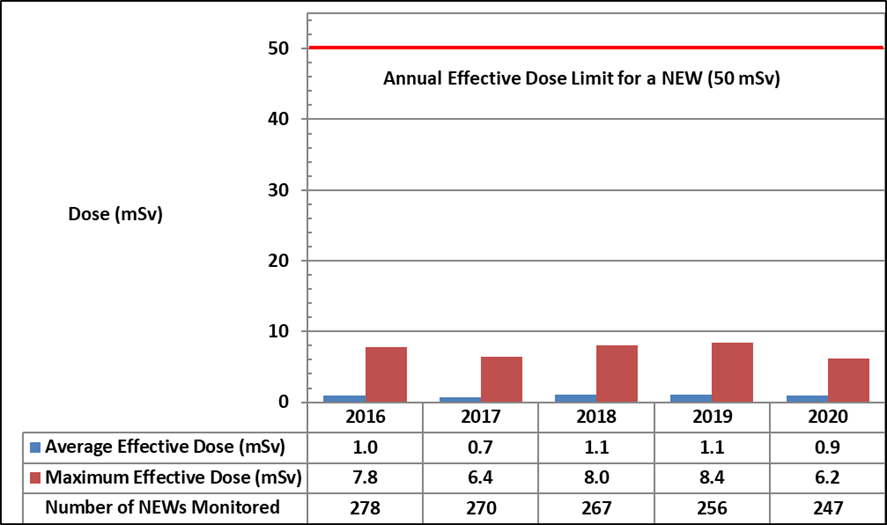
Figure J-3: Text version
| Dose statistic | 2016 | 2017 | 2018 | 2019 | 2020 |
|---|---|---|---|---|---|
| Average effective dose (mSv) | 1.0 | 0.7 | 1.1 | 1.1 | 0.9 |
| Maximum effective dose (mSv) | 7.8 | 6.4 | 8.0 | 8.4 | 6.2 |
| Number of nuclear energy workers monitored | 278 | 270 | 267 | 256 | 247 |
Note: The regulatory limit for effective dose to a nuclear energy worker is 50 mSv/year.
For the 5-year dosimetry period from January 1, 2016, to December 31, 2020, the maximum cumulative effective dose received by a NEW at CFM was 30.6 mSv. This effective dose result represents approximately 31% of the CNSC’s regulatory dose limit of 100 mSv in a 5-year dosimetry period.
Average and maximum equivalent dose results for the skin and extremities of NEWs, from 2016 to 2020, are provided in tables J-4 and J-5. In 2020, the maximum skin dose received by a NEW at CFM was 55.3 mSv, which is approximately 11% of the CNSC’s regulatory equivalent dose limit of 500 mSv in a 1-year dosimetry period. The maximum extremity dose received by a NEW at CFM was 65.6 mSv, which is approximately 13% of the CNSC’s regulatory equivalent dose limit of 500 mSv in a 1-year dosimetry period. The average and maximum equivalent doses to the skin have been decreasing over this 5-year period. CFM attributes this trend, in part, to improvements made to work practices and work areas.
| Dose data | 2016 | 2017 | 2018 | 2019 | 2020 | Regulatory limit |
|---|---|---|---|---|---|---|
| Average skin dose (mSv) | 6.6 | 5.5 | 3.4 | 3.1 | 3.1 | N/A |
| Maximum individual skin dose (mSv) | 95.7 | 88.1 | 59.0 | 56.9 | 55.3 | 500 mSv/year |
mSv = millisieverts; N/A = not applicable
| Dose data | 2016 | 2017 | 2018 | 2019 | 2020 | Regulatory limit |
|---|---|---|---|---|---|---|
| Average extremity dose (mSv) | 13.2 | 10.6 | 15.8 | 18.4 | 17.9 | N/A |
| Maximum individual extremity dose (mSv) | 98.4 | 59.0 | 57.1 | 90.8 | 65.6 | 500 mSv/year |
mSv = millisieverts; N/A = not applicable
Non-NEWs at CFM
Visitors and contractors that are not considered NEWs are issued dosimeters to monitor their radiological exposures while at CFM. In 2020, there were no measurable doses recorded on dosimeters issued to persons who were not NEWs.
BWXT Nuclear Energy Canada Inc. Toronto and Peterborough
Figure J-4 provides the average and maximum effective doses for NEWs at BWXT-NEC’s Peterborough facility between 2016 and 2020. The maximum effective dose received by a NEW in 2020 at the Peterborough facility was 6.5 millisieverts (mSv), or approximately 13% of the CNSC’s regulatory effective dose limit of 50 mSv in a 1-year dosimetry period.
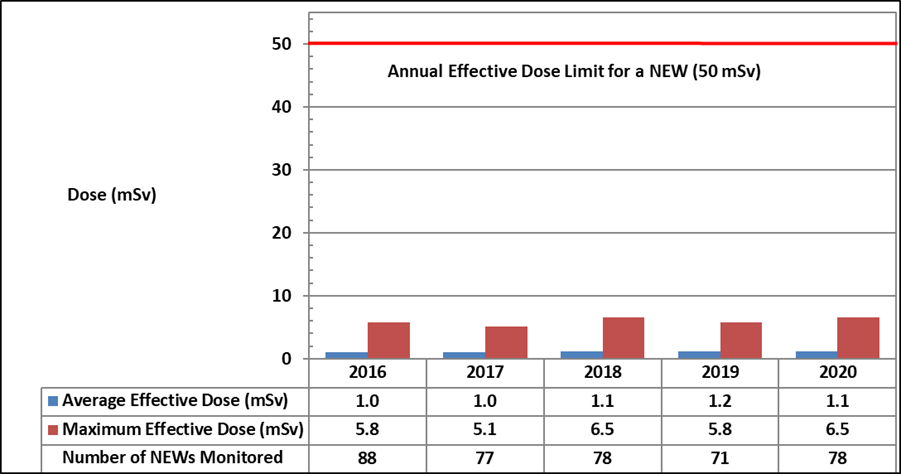
Figure J-4: Text version
| Dose statistic | 2016 | 2017 | 2018 | 2019 | 2020 |
|---|---|---|---|---|---|
| Average effective dose (mSv) | 1.0 | 1.0 | 1.1 | 1.2 | 1.1 |
| Maximum effective dose (mSv) | 5.8 | 5.1 | 6.5 | 5.8 | 6.5 |
| Number of nuclear energy workers monitored | 88 | 77 | 78 | 71 | 78 |
Note: The regulatory limit for effective dose to a nuclear energy worker is 50 mSv/year.
The maximum individual effective dose for a NEW at the Peterborough facility for the
5-year dosimetry period (January 1, 2016 to December 31, 2020) was 23.3 mSv, or approximately 23% of the CNSC’s regulatory effective dose limit of 100 mSv in a 5-year dosimetry period. This is considerably lower than the previous maximum dose of 35.6 mSv at the Peterborough site for 5-year dosimetry period from 2011 to 2015.
Figure J-5 provides the average and maximum effective doses for NEWs at BWXT-NEC’s Toronto facility between 2016 and 2020. The maximum effective dose received by a NEW in 2020 at the Toronto facility was 7.4 mSv, or approximately 15% of the CNSC’s regulatory effective dose limit of 50 mSv in a 1-year dosimetry period.
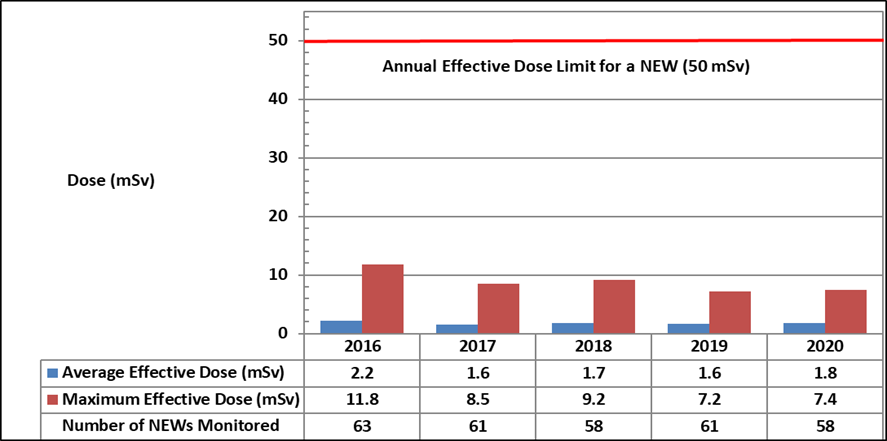
Figure J-5: Text version
| Dose statistic | 2016 | 2017 | 2018 | 2019 | 2020 |
|---|---|---|---|---|---|
| Average effective dose (mSv) | 2.2 | 1.6 | 1.7 | 1.6 | 1.8 |
| Maximum effective dose (mSv) | 11.8 | 8.5 | 9.2 | 7.2 | 7.4 |
| Number of nuclear energy workers monitored | 63 | 61 | 58 | 61 | 58 |
Note: The regulatory limit for effective dose to a nuclear energy worker is 50 mSv/year.
The maximum individual effective dose for a NEW at the Toronto facility for the 5-year dosimetry period (2016 to 2020) was 36.6 mSv, or approximately 37% of the CNSC’s regulatory effective dose limit of 100 mSv in a 5-year dosimetry period. This is comparable and slightly lower than the previous maximum dose at the Toronto site of 39.1 mSv for the 5-year dosimetry period from 2011 to 2015.
Annual average and maximum equivalent dose results for NEWs from 2016 to 2020 are also provided J-6 and J-7. In 2020, the maximum individual equivalent skin dose at the Peterborough facility was 19.01 mSv, while it was 39.1 mSv at the Toronto facility.
| Dose data | 2016 | 2017 | 2018 | 2019 | 2020 | Regulatory limit |
|---|---|---|---|---|---|---|
| Average skin dose (mSv) | 2.66 | 2.77 | 2.87 | 3.00 | 2.81 | N/A |
| Maximum individual skin dose (mSv) | 21.15 | 25.14 | 17.87 | 17.44 | 19.01 | 500 mSv/year |
mSv = millisieverts; N/A = not applicable
| Dose data | 2016 | 2017 | 2018 | 2019 | 2020 | Regulatory limit |
|---|---|---|---|---|---|---|
| Average skin dose (mSv) | 10.23 | 7.85 | 8.92 | 8.07 | 8.88 | N/A |
| Maximum individual skin dose (mSv) | 74.26 | 54.27 | 58.36 | 39.76 | 39.10 | 500 mSv/year |
mSv = millisieverts; N/A = not applicable
In 2020, the maximum individual equivalent extremity dose at the Peterborough facility was 43.17 mSv, it was 115.52 mSv at the Toronto facility, which is approximately 9% and 21% respectively, of the CNSC’s regulatory equivalent dose limit of 500 mSv in a 1-year dosimetry period, as provided in tables J-8 and J-9.
| Dose data | 2016 | 2017 | 2018 | 2019 | 2020 | Regulatory limit |
|---|---|---|---|---|---|---|
| Average extremity dose (mSv) | 9.78 | 13.62 | 14.34 | 11.30 | 18.77 | N/A |
| Maximum individual extremity dose (mSv) | 32.84 | 43.18 | 46.06 | 29.41 | 43.17 | 500 mSv/year |
mSv = millisieverts; N/A = not applicable
| Dose data | 2016 | 2017 | 2018 | 2019 | 2020 | Regulatory limit |
|---|---|---|---|---|---|---|
| Average extremity dose (mSv) | 29.58 | 27.36 | 24.56 | 20.67 | 25.37 | N/A |
| Maximum individual extremity dose (mSv) | 119.47 | 115.07 | 83.33 | 79.67 | 115.52 | 500 mSv/year |
mSv = millisieverts; N/A = not applicable
Across the 2 facilities, the maximum individual equivalent doses to the skin and the extremities were received by NEWs at the Toronto facility, and are approximately 8% and 23% (respectively) of the CNSC’s regulatory equivalent dose limit of 500 mSv in a 1-year dosimetry period. Over the past 5 years, average equivalent extremity and skin doses have been relatively stable at both facilities. The reason for the consistently lower skin and extremity doses at the Peterborough facility is the low likelihood of direct pellet handling by workers, as opposed to the Toronto facility, where this practice is routine. At the Peterborough facility, except in the end cap welding station, all pellets are shielded in zirconium tubes, bundles or boxes.
Non-NEWs at BWXT-NEC
For both the Peterborough and Toronto facilities, non-NEWs and contractors (which are all considered non-NEWs) are not directly monitored. Doses are estimated based on in-plant radiological conditions and occupancy factors, to ensure that radiation doses are controlled well below the CNSC’s regulatory effective dose limit of 1 mSv per calendar year for a person who is not a NEW.
SRB Technologies (Canada) Inc.
Figure J-6 provides the average and maximum effective doses for NEWs at SRBT from 2016 to 2020. The maximum effective dose received by a NEW in 2020 was 0.43 mSv, approximately 1% of the CNSC regulatory effective dose limit of 50 mSv in a 1-year dosimetry period. There was an increase in average effective dose during the year. This is attributed to an increase in expired exit sign processing that started in 2019 and continued into the first quarter of 2020. Noting the increase in the exposures, the licensee undertook a review and found that certain work practices were leading to an increased number of light source breakages. Corrective actions were implemented to enhance how light sources are handled in order to reduce worker exposures. These enhancements contributed to the lower maximum worker dose received in 2020.
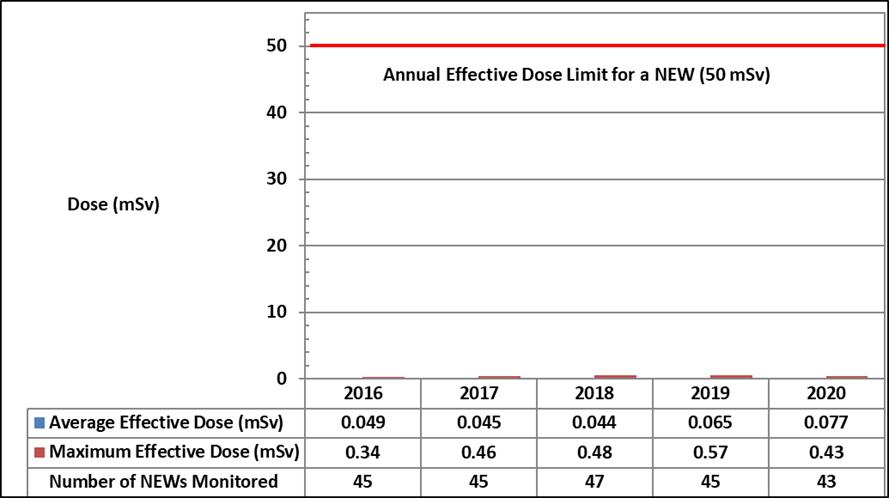
Figure J-6: Text version
| Dose statistic | 2016 | 2017 | 2018 | 2019 | 2020 |
|---|---|---|---|---|---|
| Average effective dose (mSv) | 0.05 | 0.05 | 0.04 | 0.07 | 0.08 |
| Maximum effective dose (mSv) | 0.34 | 0.46 | 0.48 | 0.57 | 0.43 |
| Number of nuclear energy workers monitored | 45 | 45 | 47 | 45 | 43 |
Note: The regulatory limit for effective dose to a nuclear energy worker is 50 mSv/year.
The maximum individual effective dose for a NEW at SRBT for the 5-year dosimetry period (2016 to 2020) was 2.20 mSv, or approximately 2.2 % of the CNSC’s regulatory effective dose limit of 100 mSv in a 5-year dosimetry period.
Due to the uniform distribution of tritium in body tissues, equivalent skin doses are essentially the same as the effective whole-body dose and are therefore not reported separately. For this same reason, extremity doses are not separately monitored for workers at SRBT.
Non-NEWs at SRBT
While contractors are not generally identified as NEWs since they do not perform radiological work, their radiological exposures are monitored while they are at the SRBT facility to ensure that their doses remain ALARA and below the CNSC regulatory dose limit of 1 mSv/year for a person who is not a NEW. In 2020, no contractors received a recordable dose that resulted from work activities performed at the facility.
Nordion (Canada) Inc.
Figure J-7 provides the average and maximum effective doses to NEWs at Nordion from 2016 to 2020. Nordion reported that the maximum effective dose received by a NEW in 2020 was 4.92 mSv, approximately 10% of the CNSC’s regulatory effective dose limit of 50 mSv in a 1-year dosimetry period. Average and maximum effective doses have been relatively stable over these years.
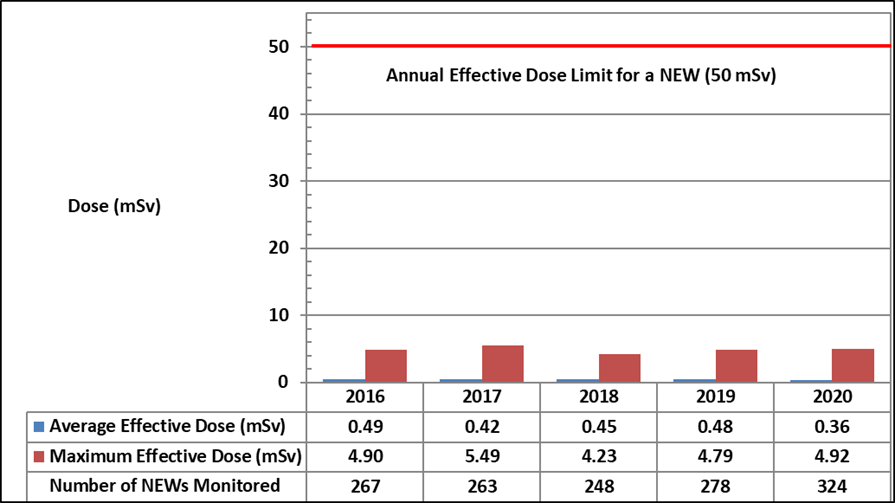
Figure J-7: Text version
| Dose statistic | 2016 | 2017 | 2018 | 2019 | 2020 |
|---|---|---|---|---|---|
| Average effective dose (mSv) | 0.49 | 0.42 | 0.45 | 0.48 | 0.36 |
| Maximum effective dose (mSv) | 4.90 | 5.49 | 4.23 | 4.79 | 4.92 |
| Number of nuclear energy workers monitored | 267 | 263 | 248 | 278 | 324 |
Note: The regulatory limit for effective dose to a nuclear energy worker is 50 mSv/year.
The maximum individual effective dose for a NEW at Nordion for the 5-year dosimetry period (2016 to 2020) was 22.85 mSv, or approximately 23 % of the CNSC’s regulatory effective dose limit of 100 mSv in a 5-year dosimetry period.
Tables J-10 and J-11 shows annual average and maximum equivalent (skin) and equivalent (extremity) dose results from 2016 to 2020. Nordion reported that the maximum equivalent skin dose for all NEWs monitored at Nordion in 2020 was 4.93 mSv, and that the maximum equivalent extremity dose for a worker in the active area was 16.48 mSv. These doses represent approximately 1% and 3% respectively of the CNSC’s regulatory equivalent dose limits of 500 mSv in a 1-year dosimetry period.
| Dose data | 2016 | 2017 | 2018 | 2019 | 2020 | Regulatory limit |
|---|---|---|---|---|---|---|
| Average skin dose (mSv) | 0.59 | 0.42 | 0.45 | 0.49 | 0.37 | N/A |
| Maximum individual skin dose (mSv) | 5.20 | 5.52 | 4.26 | 4.78 | 4.93 | 500 mSv/year |
| Dose data | 2016 | 2017 | 2018 | 2019 | 2020 | Regulatory limit |
|---|---|---|---|---|---|---|
| Average extremity dose (mSv) | 0.79 | 0.53 | 0.96 | 1.14 | 0.93 | N/A |
| Maximum individual extremity dose (mSv) | 8.3 | 16.4 | 9.08 | 20.93 | 16.48 | 500 mSv/year |
mSv = millisieverts; N/A = not applicable
Non-NEWs at Nordion
At Nordion, there may be occasions in which workers who are classified as non-NEWs enter the active area but do not perform any radiological work. Nordion monitors non-NEWs as required and provides relevant training to ensure that their doses are kept ALARA. In 2020, Nordion monitored 381 non-NEWs, which is an increase from previous years. The large increase of non-NEWs monitored is due to construction activities in the medical isotopes facility. Nordion reported that the maximum effective dose received by a non-NEW was 0.29 mSv, which is well below the CNSC’s regulatory effective dose limit of 1 mSv in a calendar year for a person who is not a NEW. The average effective dose for non-NEWs in 2020 was 0.01 mSv.
Best Theratronics Ltd.
At BTL, employees are classified as NEWs if they are expected to have a reasonable probability of receiving an annual occupational dose greater than 1 mSv. Figure J-8 provides the average and maximum effective doses for NEWs at BTL between 2016 and 2020. In 2020, the maximum effective dose received by a NEW at BTL was 0.19 mSv, or approximately 0.4% of the CNSC’s regulatory effective dose limit of 50 mSv in a 1-year dosimetry period. Over the past 5 years, annual effective doses at BTL have remained stable and very low with slight variations due to production volumes.
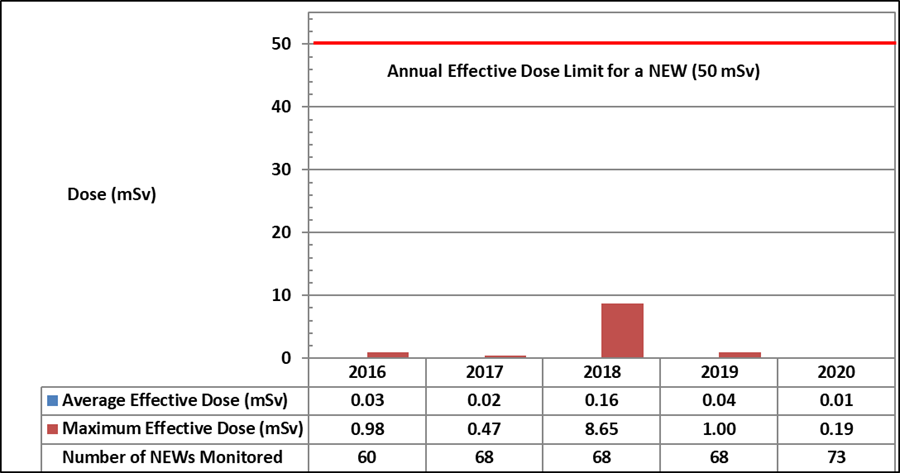
Figure J-8: Text version
| Dose statistic | 2016 | 2017 | 2018 | 2019 | 2020 |
|---|---|---|---|---|---|
| Average effective dose (mSv) | 0.03 | 0.02 | 0.16 | 0.04 | 0.01 |
| Maximum effective dose (mSv) | 0.98 | 0.47 | 8.65 | 1.00 | 0.19 |
| Number of nuclear energy workers monitored | 60 | 68 | 68 | 68 | 73 |
Note: The regulatory limit for effective dose to a nuclear energy worker is 50 mSv/year.
The maximum individual effective dose for a NEW at BTL for the 5-year dosimetry period (2016 to 2020) was 8.65 mSv, or approximately 8.7% of the CNSC’s regulatory effective dose limit of 100 mSv in a 5-year dosimetry period, all of which was accrued during the 2018 event mentioned above.
The higher-than-normal maximum effective and equivalent extremity doses in 2018 were due to an unplanned upset condition that resulted in an action level exceedance. Annual average and maximum equivalent extremity dose results from 2016 to 2020 are provided in Table J-12. The maximum equivalent extremity dose for 2020 was 2.4 mSv, which is approximately 0.5% of the CNSC’s regulatory equivalent dose limit of 500 mSv. Over the past 5 years, average extremity equivalent doses have remained very low, between approximately 0 and 2 mSv.
| Dose Data | 2016 | 2017 | 2018 | 2019 | 2020 | Regulatory Limit |
|---|---|---|---|---|---|---|
| Average extremity dose (mSv) | 0.09 | 0.07 | 1.41 | 0.22 | 0.15 | N/A |
| Maximum individual extremity dose (mSv) | 29.9 | 11.2 | 13.51 | 2.51 | 2.4 | 500 mSv/year |
mSv = millisieverts; N/A = not applicable
Although equivalent skin doses are ascertained; due to the nature of exposure, they are essentially equal to the effective dose and are not included in this report.
Non-NEWs at BTL
BTL workers identified as non-NEWs, such as administrative staff, are not permitted in controlled areas, and are therefore not occupationally exposed to radiation.
Polytechnique Montréal SLOWPOKE-2
Polytechnique Montréal workers are exposed externally to sources of radiation. However, due to the low potential for exposures, Polytechnique Montréal workers are classified as non-NEWs and the 5-year dosimetry period does not apply.
Figure J-9 provides the average and maximum effective doses received for non-NEWs at Polytechnique Montréal between 2016 and 2020. From 2018 to 2020, the maximum annual effective dose received by a non-NEW at Polytechnique Montréal was 0.14 mSv, or approximately 14% of the CNSC’s regulatory annual effective dose limit of 1 mSv.
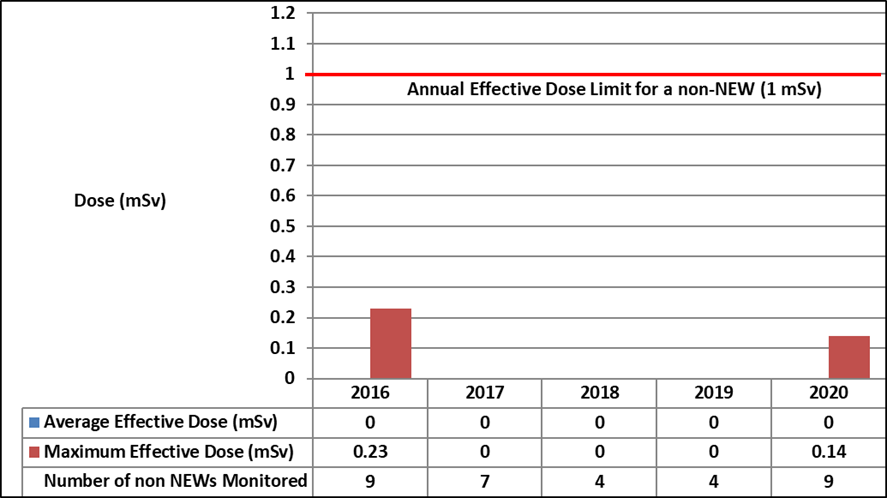
Figure J-9: Text version
| Dose statistic | 2016 | 2017 | 2018 | 2019 | 2020 |
|---|---|---|---|---|---|
| Average effective dose (mSv) | 0 | 0 | 0 | 0 | 0 |
| Maximum effective dose (mSv) | 0.23 | 0 | 0 | 0 | 0.14 |
| Number of non-nuclear energy workers monitored | 9 | 7 | 4 | 4 | 9 |
Note: The regulatory limit for effective dose to a non-nuclear energy worker is 1 mSv/year.
From 2018 to 2020, there were no action level exceedances at Polytechnique Montréal . Over the past 5 years, annual effective doses at Polytechnique Montréal have remained stable and very low.
McMaster Nuclear Reactor
Figure J-10 provides the average and maximum effective doses for NEWs at MNR between 2016 and 2020. From 2018 to 2020, it was reported that no internal doses were recorded at the facility. Average and maximum effective doses over this 5-year period are reflective of the work activities at MNR, and are influenced by factors such as production levels and the scope of radiological work activities. The maximum effective dose, in each of the years from 2016 to 2020, was received by a NEW working as part of the NRay neutron radiography staff. All of the contribution to doses to NEWs working for NRay are from external sources.
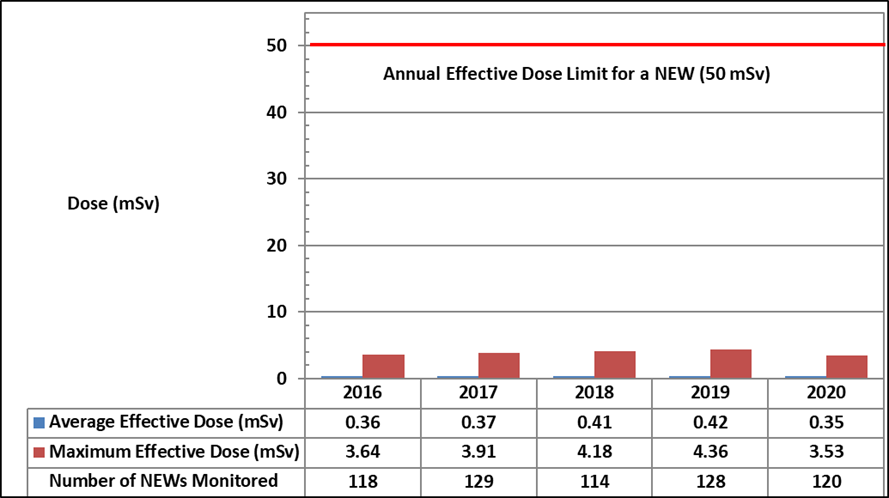
Figure J-10: Text version
| Dose statistic | 2016 | 2017 | 2018 | 2019 | 2020 |
|---|---|---|---|---|---|
| Average effective dose (mSv) | 0.36 | 0.37 | 0.41 | 0.42 | 0.35 |
| Maximum effective dose (mSv) | 3.64 | 3.91 | 4.18 | 4.36 | 3.53 |
| Number of nuclear energy workers monitored | 118 | 129 | 114 | 128 | 120 |
Note: The regulatory limit for effective dose to a nuclear energy worker is 50 mSv/year.
For the 5-year dosimetry period, which began January 1, 2016, and concluded on December 31, 2020, the maximum cumulative effective dose received by a NEW at the MNR was 15.94 mSv, which is well below the CNSC’s regulatory effective dose limit of 100 mSv in a 5-year dosimetry period.
Average and maximum equivalent dose results for the skin and extremities of NEWs, from 2016 to 2020, are provided in Tables J-13 and J-14. Between 2016 and 2020, the maximum individual skin dose received by a NEW at MNR was 11.75 mSv, which is approximately 2% of the CNSC’s regulatory equivalent dose limit of 500 mSv in a 1-year dosimetry period.
The maximum individual extremity dose received by a NEW at MNR was 47.24 mSv, which is approximately 9% of the CNSC’s regulatory equivalent dose limit of 500 mSv in a 1-year dosimetry period.
| Dose data | 2016 | 2017 | 2018 | 2019 | 2020 | Regulatory dose limit |
|---|---|---|---|---|---|---|
| Average extremity dose (mSv) | 0.45 | 0.50 | 0.55 | 0.59 | 0.59 | -- |
| Maximum individual skin dose (mSv) | 4.28 | 4.23 | 6.25 | 11.75 | 11.09 | 500 mSv/year |
| Dose data | 2016 | 2017 | 2018 | 2019 | 2020 | Regulatory dose limit |
|---|---|---|---|---|---|---|
| Average extremity dose (mSv) | 6.90 | 6.21 | 5.84 | 6.86 | 4.78 | -- |
| Maximum individual extremity dose (mSv) | 42.00 | 43.96 | 38.09 | 47.24 | 29.24 | 500 mSv/year |
Non-NEWs at the MNR
Site visitors and contractors that are not considered NEWs are issued electronic personal dosimeters to monitor their radiological exposures while at the MNR. Between 2016 and 2020, the maximum individual effective dose received by a site visitor or contactor that was not a NEW was 0.017 mSv, which is well below the CNSC’s regulatory effective dose limit of 1 mSv per calendar year for a person who is not a NEW.
Royal Military College of Canada SLOWPOKE-2
RMC workers are exposed externally to sources of radiation. No doses have been recorded for any NEW over the last 5 years, and therefore over the 5-year dosimetry period. Due to the low potential for exposures, doses to RMC workers are expected to be below 1 mSv and are therefore compared to the annual effective dose limit for a non-NEW (1 mSv). External whole body and equivalent doses are ascertained using licensed dosimeters.
No worker received a dose above the minimum reporting threshold for the dosimeter
(i.e. less than 0.1 mSv). Figure J.11 provides the average and maximum effective doses received for NEWs at RMC between 2016 and 2020. From 2018 to 2020, the maximum annual effective dose received by a NEW at RMC was 0 mSv.
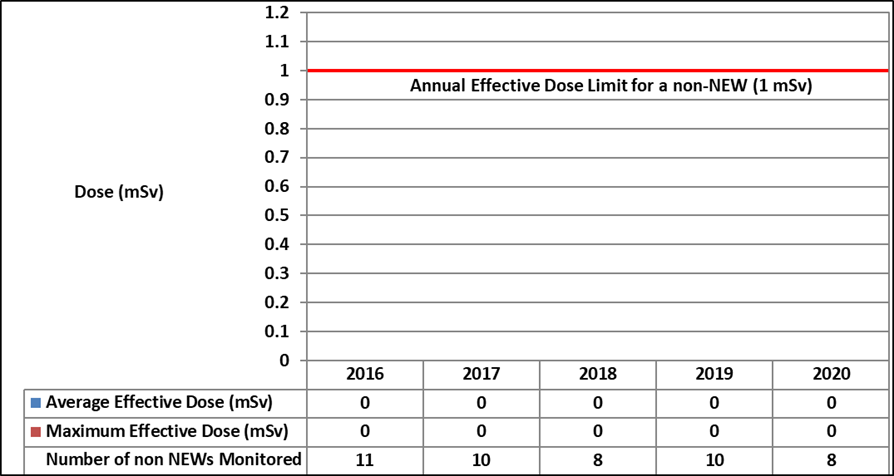
Figure J-11: Text version
| Dose statistic | 2016 | 2017 | 2018 | 2019 | 2020 |
|---|---|---|---|---|---|
| Average effective dose (mSv) | 0 | 0 | 0 | 0 | 0 |
| Maximum effective dose (mSv) | 0 | 0 | 0 | 0 | 0 |
| Number of non-nuclear energy workers monitored | 11 | 10 | 8 | 10 | 8 |
Note: The regulatory limit for effective dose to a non-nuclear energy worker is 1 mSv/year.
From 2018 to 2020, there were no action level exceedances at RMC. Over the past 5 years, annual effective doses at RMC have remained stable and very low.
Saskatchewan Research Council SLOWPOKE-2
Due to the low potential for exposures, SRC workers are classified as non-NEWs and therefore the 5-year dosimetry period does not apply. During the entire life of the facility, only on rare occasions have workers exceeded the reporting threshold of 0.1 mSv for the licensed dosimeters used at SRC.
Figure J-12 provides the average and maximum effective doses for non-NEWs at SRC between 2016 and 2020. From 2018 to 2020, the maximum annual effective dose received by a non-NEW at SRC was 0.16 mSv, or approximately 16% of the CNSC’s regulatory annual effective dose limit of 1 mSv. This dose was received during decommissioning activities in 2020.
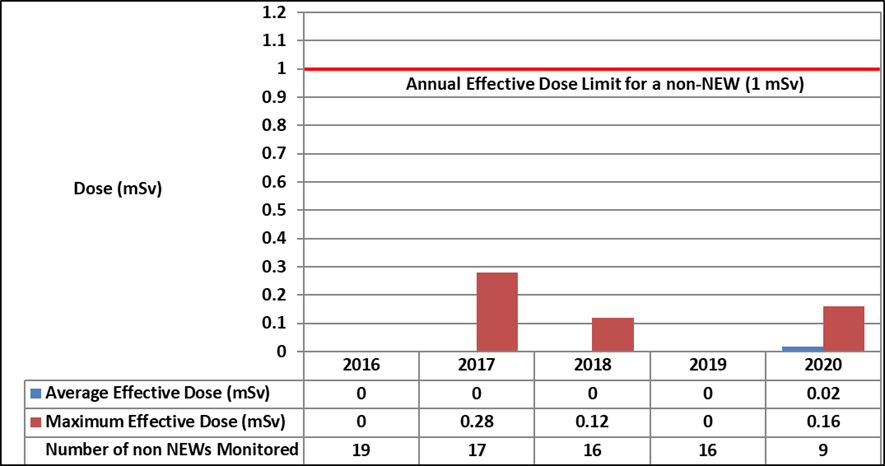
Figure J-12: Text version
| Dose statistic | 2016 | 2017 | 2018 | 2019 | 2020 |
|---|---|---|---|---|---|
| Average effective dose (mSv) | 0 | 0 | 0 | 0 | 0.02 |
| Maximum effective dose (mSv) | 0 | 0.28 | 0.12 | 0 | 0.16 |
| Number of non-nuclear energy workers monitored | 19 | 17 | 16 | 16 | 9 |
Note: The regulatory limit for effective dose to a non-nuclear energy worker is 1 mSv/year.
From 2018 to 2020, there were no action level exceedances at SRC. Over the past 5 years, annual effective doses at SRC have remained stable and very low.
K. Health and Safety Data
| Facility | Statistic | 2016 | 2017 | 2018 | 2019 | 2020 |
|---|---|---|---|---|---|---|
| BRR | LTIFootnote 17 | 0 | 0 | 0 | 0 | 0 |
| Severity rateFootnote 18 | 0 | 0 | 0 | 0 | 0 | |
| Frequency rateFootnote 19 | 0 | 0 | 0 | 0 | 0 | |
| PHCF | LTI | 4 | 1 | 2 | 0 | 0 |
| Severity rate | 2.40 | 1.67 | 7.58 | 0 | 0 | |
| Frequency rate | 0.80 | 0.28 | 0.49 | 0 | 0 | |
| CFM | LTI | 0 | 0 | 0 | 0 | 0 |
| Severity rate | 0 | 0 | 0 | 0 | 0 | |
| Frequency rate | 0 | 0 | 0 | 0 | 0 | |
| BWXT-NEC | LTI | 0 | 0 | 0 | 0 | 0 |
| Severity rate | 0 | 0 | 0 | 0 | 0 | |
| Frequency rate | 0 | 0 | 0 | 0 | 0 | |
| SRBT | LTI | 0 | 3 | 0 | 0 | 0 |
| Severity rate | 0 | 17.7 | 0 | 0 | 0 | |
| Frequency rate | 0 | 7.6 | 0 | 0 | 0 | |
| Nordion | LTI | 3 | 1 | 0 | 2 | 0 |
| Severity rate | 70.04 | 5.61 | 0 | 4.15 | 0 | |
| Frequency rate | 2.32 | 0.93 | 0 | 0.69 | 0 | |
| BTL | LTI | 3 | 1 | 2 | 2 | 0 |
| Severity rate | 37.61 | 15.00 | 8.21 | 5.47 | 0 | |
| Frequency rate | 2.05 | 0.68 | 1.37 | 1.37 | 0 | |
| Polytechnique Montréal | LTI | 0 | 0 | 0 | 0 | 0 |
| Severity rate | 0 | 0 | 0 | 0 | 0 | |
| Frequency rate | 0 | 0 | 0 | 0 | 0 | |
| MNR | LTI | 0 | 0 | 0 | 0 | 0 |
| Severity rate | 0 | 0 | 0 | 0 | 0 | |
| Frequency rate | 0 | 0 | 0 | 0 | 0 | |
| RMC | LTI | 0 | 0 | 0 | 0 | 0 |
| Severity rate | 0 | 0 | 0 | 0 | 0 | |
| Frequency rate | 0 | 0 | 0 | 0 | 0 | |
| SRC | LTI | 0 | 0 | 0 | 0 | 0 |
| Severity rate | 0 | 0 | 0 | 0 | 0 | |
| Frequency rate | 0 | 0 | 0 | 0 | 0 |
L. Reportable Events
| Facility | Number of events |
|---|---|
| BRR | 3 |
| PHCF | 8 |
| CFM | 1 |
| BWXT-NEC Toronto | 0 |
| BWXT-NEC Peterborough | 1 |
| SRBT | 0 |
| Nordion | 10 |
| BTL | 1 |
| Polytechnique Montréal | 1 |
| MNR | 1 |
| RMC | 0 |
| SRC | 0 |
| TOTAL | 26 |
M. List of Identified Indigenous Nations and Communities With an Interest in Uranium and Nuclear Substance Processing Facilities
Blind River area (BRR)
- Mississauga First Nation
- Sagamok Anishnawbek Nation
- Serpent River First Nation
- Thessalon First Nation
- Métis Nation of Ontario (Region 4)
Facilities in Port Hope, Toronto and Peterborough areas (PHCF, CFM, and BWXT-NEC facilities in Toronto and Peterborough)
- Williams Treaties First Nations, which include Alderville First Nation, Curve Lake First Nation, Hiawatha First Nation, the Mississaugas of Scugog Island First Nation, the Chippewas of Beausoleil First Nation, the Chippewas of Georgina Island First Nation and the Chippewas of Rama First Nation
- Mississaugas of the Credit First Nation
- Métis Nation of Ontario (Region 6 and 8)
- Mohawks of the Bay of Quinte
Ottawa Valley facilities (SRBT, Nordion, and BTL)
- Algonquins of Ontario
- Algonquins of Pikwà kanagà n First Nation
- Kitigan Zibi Anishinabeg
- Algonquin Anishinabeg Nation Tribal Council
- Kebaowek First Nation
- Métis Nation of Ontario (Regions 5 and 6)
- Mohawks of the Bay of Quinte
N. Participant Funding Recipients for the 2020 UNSPF and RRs Regulatory Oversight Report
Recipient
- Curve Lake First Nation
- Algonquins of Ontario
Further information on the CNSC’s participant funding program can be found on the CNSC website.
Footnotes
- Footnote 1
-
Each alphanumeric expression refers to the licence held by the licensee.
- Footnote 2
-
The safeguards and non-proliferation SCA is not applicable to SRBT as there is no licence condition for the facility. SRBT manages a small quantity of depleted uranium (below exemption quantity as per the Nuclear Substances and Radiation Devices Regulations), used as storage media for tritium, not for its radioactive properties.
- Footnote 3
-
Type A and B packages are classified and designed in accordance with the applicable requirements of the IAEA regulations.
- Footnote 4
-
No annual compliance report (ACR) was provided by SRC for 2020, as decommissioning of the facility was completed in 2020. SRC submitted an end-state decommissioning report in support of its request for a licence to abandon a nuclear facility.
- Footnote 5
-
SRC had applied for a licence to abandon and the Commission issued this licence to abandon on October 1, 2021
- Footnote 6
-
This SLOWPOKE-2 facility is owned by National Defence and is therefore the property of the Crown. The costs associated with future decommissioning of this facility are the responsibility of National Defence.
- Footnote 7
-
No decommissioning activities remain, so a financial guarantee is no longer required. CNSC staff have recommended the release of the financial guarantee funds, which will occur if a licence to abandon is granted (CMD 21-H104).
- Footnote 8
-
Specific IAEA reporting and verification activities are held in abeyance.
- Footnote 9
-
In 2016, PHCF updated the dose calculations related to releases to water and the fenceline gamma locations used for reporting the dose to the public. The amounts in 2017 and 2018 look higher than in previous years, but there has not been an actual increase in emissions/dose from the facility. The results represent a much more conservative estimate of dose to the public, as the gamma monitoring location at the facility fenceline is now closer to the operating facility than the previous location, resulting in the increase shown in the table. For this reason, the results beginning in 2017 cannot be compared with previous years’ results.
- Footnote 10
-
No activities occur inside the BTL facility that result in the release of radioactive material to the environment.
- Footnote 11
-
These values were estimated by CNSC staff using a sector-specific environmental risk assessment model.
- Footnote 12
-
None of the groundwater wells monitored are used for drinking water. The GCDWQ are health based and representative of the maximum acceptable concentrations.
- Footnote 13
-
Denotes values for station number 13. The results at stations 2 and 13 are used for Site 1 public dose calculations prior to July 1, 2019 and stations 2 and 10 are used for Site 1 public dose calculations after July 1, 2019 due to the removal of station 13 at Centre Pier.
- Footnote 14
-
CFM reverted to a 3-year soil monitoring program starting in 2010.
- Footnote 15
-
Ontario standard for uranium in ambient air is 0.03 μg/m3.
- Footnote 16
-
Only the workers who routinely work in the active area are monitored for extremity dose.
- Footnote 17
-
An LTI is an injury that takes place at work and results in the worker being unable to return to work for a period of time.
- Footnote 18
-
The accident severity rate measures the total number of days lost to injury for every 200,000 person-hours worked at the site. Severity = [(# of days lost in last 12 months) / (# of hours worked in last 12 months)] x 200,000.
- Footnote 19
-
The accident frequency rate measuring the number of LTIs for every 200,000 person-hours worked at the site. Frequency = [(# of injuries in last 12 months) / (# of hours worked in last 12 months)] x 200,000.
Page details
- Date modified: